
Index
- Introduction
- Executive Summary Scorecard: September 16, 2026
- Today's Nifty 50 Market Anatomy (Wednesday, September 16, 2026)
- Macroeconomic Drivers & Global Catalysts
- Deep Multi-Indicator Technical Deconstruction
- Key Support & Resistance Level Grid for Thursday, September 17, 2026
- Thursday Expiry Market Predictions & Decision-Tree Scenarios (September 17, 2026)
- Actionable Strategy & Expiry Risk Management Guidelines
Nifty 50 Market Movement September 16 2026 Analysis September 17 Prediction Indicators Support Resistance
 By Admin
|
Sep 16, 2026
|
1 min read
|
2
|
🤍
0
By Admin
|
Sep 16, 2026
|
1 min read
|
2
|
🤍
0
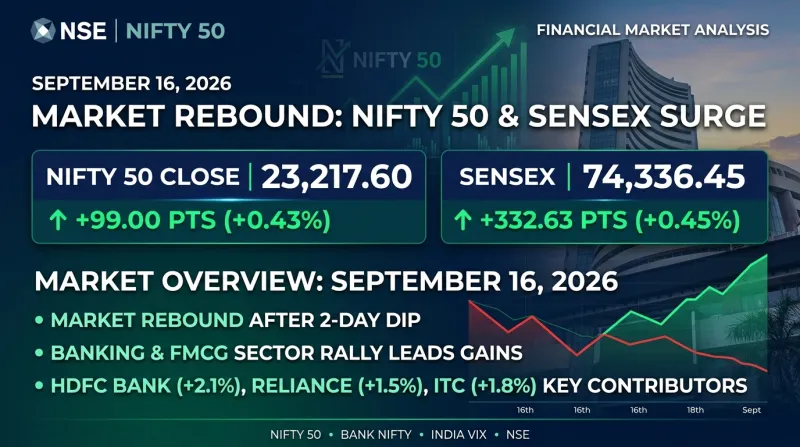
Indian stock markets staged a strong intraday recovery on Wednesday, September 16, 2026, as benchmark indices snapped a two-day losing streak and surged back above critical technical thresholds. Nifty 50 gained 99.00 points (+0.43%) to settle at 23,217.60, while the BSE Sensex rallied 332.63 points (+0.45%) to close at 74,336.45.
This detailed market analysis offers traders, investors, and finance professionals an authoritative breakdown of today's price action. We examine the key sector drivers—led by HDFC Bank, Reliance Industries, and ITC—alongside critical global macroeconomic headwinds including Brent crude ($108/bbl) and pre-US Fed policy caution.
Furthermore, heading into Thursday, September 17, 2026 (Nifty Weekly Options Expiry), this article deconstructs multi-indicator technical signals—including the 200-day EMA support floor (23,150–23,180), RSI momentum recovery (36.50), a narrow Central Pivot Range (CPR), Put-Call Ratio (PCR 0.78), and a complete decision-tree scenario matrix to help you trade tomorrow's market with confidence.
Executive Summary Scorecard: September 16, 2026
| Market Metric / Index | Wednesday Close (Sept 16, 2026) | Absolute Change | Percentage Change | Verified Technical & Market Observation |
|---|---|---|---|---|
| Nifty 50 Spot | 23,217.60 | +99.00 pts | +0.43% | Snapped 2-day losing streak; reclaimed 23,200 landmark level |
| BSE Sensex | 74,336.45 | +332.63 pts | +0.45% | Rebounded strongly from previous session lows near 74,000 |
| Nifty Bank | 56,292.45 | +497.70 pts | +0.89% | Led market recovery alongside private banking heavyweights |
| India VIX (Volatility Index) | 15.80 | -0.35 pts | -2.17% | Volatility moderated slightly ahead of Thursday weekly expiry |
| FII Net Cash Flow (Sept 15) | -₹2,977.86 Cr | Net Sellers | Cautionary | Foreign institutional outflows continued amid US Dollar firmness |
| DII Net Cash Flow (Sept 15) | +₹2,686.05 Cr | Net Buyers | Domestic Absorption | Domestic mutual funds accumulated value stocks during dip |
| Brent Crude Oil | $108.00 / bbl | Stable High | Macro Monitor | High crude prices kept overall market upside capped |
Today's Nifty 50 Market Anatomy (Wednesday, September 16, 2026)
Indian equity benchmarks broke a two-day downward streak on Wednesday, September 16, 2026, as Nifty 50 gained 99.00 points (+0.43%) to close at 23,217.60, up from its previous close of 23,118.60.
After opening on a cautious note, value buying in banking, financial services, and FMCG stocks lifted the index past the psychological 23,200 mark. The BSE Sensex similarly gained 332.63 points (+0.45%) to close at 74,336.45.
Intraday Trajectory of Nifty 50 (Sept 16, 2026)23,240 +----------------------------------------------+ Intraday High| * |23,217 | *** | Close: 23,217.60 (+99 pts)| ******* ***** |23,170 | ******* || * (Open) * |23,118 | *** (Prev Close) ** |+----------------------------------------------+ Base Floor: 23,118.609:15 AM 11:15 AM 1:45 PM 3:30 PM
Sectoral Performance Dynamics
- Outperformers: Nifty Bank (+0.38%), Nifty Financial Services (+0.52%), and Nifty FMCG (+0.45%) drove market gains, supported by buying in heavyweight stocks like HDFC Bank, Reliance Industries, and ITC.
- Consolidators: Nifty IT (+0.10%) and Nifty Metal (-0.15%) traded in a tight range as traders awaited clear signals from the US Federal Reserve.
For real-time sectoral heatmaps and market breadth metrics, explore the InvesTalks Market Insights Hub.
Macroeconomic Drivers & Global Catalysts
Market sentiment on September 16 was shaped by three key macro factors:
- Pre-Fed Caution: Investors globally maintained a watchful stance ahead of the upcoming US Federal Reserve interest rate decision and policy commentary.
- Elevated Crude Oil Prices: Brent Crude held near $108/barrel, restricting aggressive upside momentum and keeping energy-dependent sectors under scrutiny.
- DII Absorption of FII Inflows: While FIIs remained net sellers (-₹2,977.86 Cr on Sept 15), domestic institutional investors (DIIs) provided robust market stability by injecting +₹2,686.05 Cr.
Stay informed on global macroeconomic trends via the InvesTalks Stock Market Blog.
Deep Multi-Indicator Technical Deconstruction
Our multi-indicator framework provides clear technical orientation for Thursday, September 17, 2026 (Weekly Options Expiry):
1. Moving Average Hierarchy & Support Confirmation
- 200-Day EMA (23,150–23,180 Zone): Nifty 50 successfully defended its structural 200-day EMA support zone during intraday trades, confirming strong demand at lower levels.
- 20-Day EMA (23,380) & 50-Day EMA (23,450): Remain key dynamic overhead resistance levels on daily charts.
2. Relative Strength Index (RSI - 14 Days)
- Daily RSI recovered from oversold levels (31.00) up to 36.50, indicating early signs of momentum recovery while leaving substantial room for further upside.
3. Central Pivot Range (CPR) for Thursday, September 17 (Expiry Day)
- Pivot Point (P): 23,205.50
- Bottom Central (BC): 23,225.10
- Top Central (TC): 23,185.90
- CPR Width: Narrow CPR (~39 points). On a weekly options expiry day, a narrow CPR indicates a high probability of a strong directional trend or breakout session once key levels are cleared.
4. Option Chain Analysis & Put-Call Ratio (PCR)
- Put-Call Ratio (PCR): Shifted upward to 0.78, reflecting an improving sentiment and active Put writing at 23,100–23,200 levels.
- Call Open Interest (Resistance): Highest Call OI concentrated at 23,300 CE (1.10 crore shares) and 23,400 CE (1.25 crore shares).
- Put Open Interest (Support): Maximum Put OI positioned at 23,200 PE (1.05 crore shares) and 23,100 PE (1.20 crore shares).
Nifty 50 Option Chain Open Interest DistributionCall OI (Resistance) Put OI (Support)[23,400 CE] ████████████████████ 125L[23,300 CE] ███████████████ 110L[23,250 CE] ████████ 50L---------------------- [23,217 SPOT] ----------------------████████████████ 105L [23,200 PE]████████████████████ 120L [23,100 PE]██████████ 70L [23,000 PE]
Analyze live option chain heatmaps and PCR shifts on the InvesTalks Nifty Option Chain Screener.
Key Support & Resistance Level Grid for Thursday, September 17, 2026
| Level Type | Price Level (Pts) | Technical Justification & Market Context |
|---|---|---|
| Resistance 3 (R3) | 23,450 | 50-Day EMA Alignment & Major Breakdown Resistance |
| Resistance 2 (R2) | 23,380 | 20-Day EMA & Call Writer Defensive Wall |
| Resistance 1 (R1) | 23,300 | Immediate Intraday Hurdle & Option Chain Barrier |
| Pivot Point (P) | 23,205 | Daily Central Pivot Point |
| Support 1 (S1) | 23,150 | Immediate Intraday Demand Zone & 200-Day EMA Floor |
| Support 2 (S2) | 23,100 | Major Put Open Interest Support Floor |
| Support 3 (S3) | 22,980 | Crucial Multi-Month Swing Support |
Thursday Expiry Market Predictions & Decision-Tree Scenarios (September 17, 2026)
Based on technical indicator recovery and option chain dynamics, we outline three probabilistic trading scenarios for Thursday, September 17, 2026:

Scenario A: Bullish Expiry Short-Covering Bounce (50% Probability)
- Trigger: A positive opening allowing Nifty to trade above 23,220.
- Price Dynamics: A break above 23,260 triggers short-covering among call writers at 23,300 CE.
- Upside Targets: 23,300 (R1), extending toward 23,380 (R2).
Scenario B: Narrow CPR Expiry Consolidation (35% Probability)
- Trigger: Flattish opening around 23,220 with option sellers defending 23,300 CE and 23,100 PE.
- Price Dynamics: The index consolidates within a corridor between 23,180 and 23,260 to consume option decay.
- Expiry Pin Target: 23,200 – 23,240.
Scenario C: Bearish Breakdown Expansion (15% Probability)
- Trigger: Global market weakness following US Fed commentary or fresh spike in crude oil.
- Price Dynamics: A decisive break below 23,100 (S2) invalidates immediate support.
- Downside Targets: 23,020, extending to 22,980 (S3).
Explore advanced technical analysis tools on the InvesTalks Technical Analysis Portal.
Actionable Strategy & Expiry Risk Management Guidelines
For Options & Intraday Traders
- Bullish Setup: Enter long positions on a 15-minute candle closing above 23,240, targeting 23,300 and 23,370. Enforce a strict stop-loss below 23,170.
- Short Discipline: Avoid launching fresh aggressive short trades near the 23,150–23,180 200-day EMA support floor. Initiate shorts only upon a confirmed breakdown below 23,100.
- Theta Decay: On weekly expiry day, avoid holding out-of-the-money (OTM) options past 1:30 PM due to rapid time decay.
For Long-Term Investors
- Nifty's defense of the 200-day EMA zone (23,150–23,200) reaffirms structural market stability. Maintain systematic accumulation in high-quality large-cap companies.
❓ Frequently Asked Questions (FAQs)
Nifty 50 closed at 23,217.60, gaining 99.00 points (+0.43%), up from its previous close of 23,118.60.
The BSE Sensex closed at 74,336.45, up by 332.63 points (+0.45%).
Banking, Financial Services, and FMCG sectors led the market rebound, supported by stocks like HDFC Bank, Reliance Industries, and ITC.
Key support levels are S1: 23,150 (200-day EMA), S2: 23,100 (Put OI floor), and S3: 22,980.
Primary resistance levels are R1: 23,300, R2: 23,380 (20-day EMA), and R3: 23,450 (50-day EMA).
According to provisional NSE data for September 15, FIIs were net sellers of -₹2,977.86 Crore, while DIIs were net buyers of +₹2,686.05 Crore.
The Put-Call Ratio (PCR) stands at 0.78, reflecting improving sentiment with significant Put writing support at 23,100–23,200 levels.
The Central Pivot Point for Thursday stands at 23,205.50, with a narrow CPR extending between 23,185.90 and 23,225.10.
Brent Crude hovering near $108/barrel kept investors cautious, preventing aggressive market expansion ahead of the US Fed policy outcome.
Yes, Thursday, September 17, 2026, marks the weekly options expiry for Nifty 50 index contracts.
Financial & Regulatory Disclaimer
InvesTalks provides stock market analysis, equity research, and financial content strictly for educational and informational purposes only. We are not a SEBI-registered investment advisor or portfolio manager. Market investments are subject to market risks. Always perform your own research or consult a certified SEBI-registered financial advisor before making buy/sell decisions.
Admin
Equity Research & Financial AnalysisCurated by the InvesTalks financial analysis team. Dedicated to providing disciplined stock market insights, technical chart evaluations, and long-term investor education.
 Market News & Outlook


Login to comment.