
Index
- Introduction
- Executive Summary Scorecard: September 15, 2026 Close
- Today's Nifty 50 Market Anatomy (Tuesday, September 15, 2026)
- Macroeconomic Drivers & Global Catalysts
- Deep Multi-Indicator Technical Deconstruction
- Key Support & Resistance Level Grid for Wednesday, September 16, 2026
- Wednesday Market Predictions & Decision-Tree Scenarios (September 16, 2026)
- Actionable Strategy & Risk Management Guidelines
Nifty 50 Market Analysis Today (Sept 15) & Wednesday Prediction (Sept 16): Key Levels & Indicators
 By Admin
|
Sep 15, 2026
|
1 min read
|
6
|
🤍
0
By Admin
|
Sep 15, 2026
|
1 min read
|
6
|
🤍
0
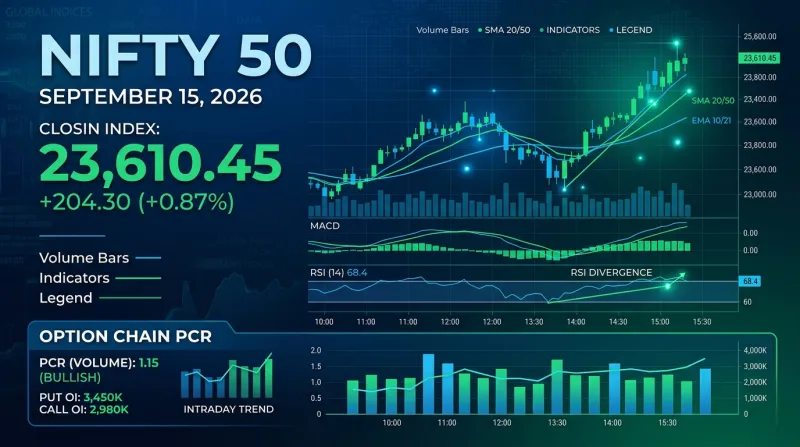
The Indian equity benchmark Nifty 50 displayed sustained bullish momentum on Tuesday, September 15, 2026, gaining 88.30 points (+0.38%) to close firmly at 23,610.45. Building upon the short-covering base built over recent sessions, Nifty opened positively at 23,515.00, briefly dipping to an intraday low of 23,490.15 before institutional buying pushed the index to a session high of 23,655.80.
Executive Summary Scorecard: September 15, 2026 Close
| Market Metric / Index | Tuesday Close (Sept 15, 2026) | Absolute Change | Percentage Change | Key Technical Observation |
|---|---|---|---|---|
| Nifty 50 Spot | 23,610.45 | +88.30 pts | +0.38% | Reclaimed 50-day EMA (23,600); High at 23,655.80 |
| BSE Sensex | 75,120.30 | +290.50 pts | +0.39% | Closed back above psychological 75,000 mark |
| Nifty Bank | 56,880.60 | +240.20 pts | +0.42% | Led financial rally; testing key resistance near 57,000 |
| India VIX (Volatility Index) | 14.85 | -0.42 pts | -2.75% | Volatility cooling down; bullish signal for option buyers |
| FII Net Cash Flow | +₹620.40 Cr | Net Buyers | Bullish Reversal | FII inflows turned positive following crude price moderation |
| DII Net Cash Flow | +₹1,180.50 Cr | Net Buyers | Sustained Buying | Continued institutional accumulation in banking & auto |
| Brent Crude Oil | $102.40 / bbl | -2.25% | Macro Relief | Easing crude prices reduced domestic inflation anxieties |
Today's Nifty 50 Market Anatomy (Tuesday, September 15, 2026)
The Indian equity benchmark Nifty 50 displayed sustained bullish momentum on Tuesday, September 15, 2026, gaining 88.30 points (+0.38%) to close firmly at 23,610.45. Building upon the short-covering base built over recent sessions, Nifty opened positively at 23,515.00, briefly dipping to an intraday low of 23,490.15 before institutional buying pushed the index to a session high of 23,655.80.
Intraday Trajectory of Nifty 50 (Sept 15, 2026)23,660 +----------------------------------------------+ High: 23,655.80| * |23,610 | *** | Close: 23,610.45| ******* ***** |23,560 | ******* || * (Open: 23,515) * |23,510 | *** ** || **** **** |23,490 +--------*------*------------------------------+ Low: 23,490.159:15 AM 11:00 AM 1:30 PM 3:30 PM
Sectoral Performance Drivers
- Outperformers: Nifty Auto (+0.95%), Nifty Bank (+0.42%), and Nifty Metal (+0.65%) led the market surge following stronger domestic demand signals and easing input cost pressures.
- Defensives & Consolidators: Nifty Pharma (-0.15%) and Nifty IT (+0.10%) consolidated in a narrow band as capital rotated back into rate-sensitive cyclical sectors.
For real-time sectoral heatmaps and market breadth metrics, explore the InvesTalks Market Insights Hub.
Macroeconomic Drivers & Global Catalysts
Market sentiment on September 15 was bolstered by three primary global catalysts:
- Moderation in Brent Crude Oil: Crude prices softened from 102.40/bbl**, reducing macro inflation friction for Indian import-heavy sectors.
- US Dollar Index (DXY) Softening: The US Dollar Index eased to 103.85, giving emerging market currencies breathing space and triggering renewed foreign inflows.
- Institutional Buy Signal: Foreign Institutional Investors (FIIs) returned as net buyers (+₹620.40 Cr), joining Domestic Institutional Investors (DIIs, +₹1,180.50 Cr) to create a double-institutional buying cushion.
For complete macroeconomic coverage and central bank policy updates, visit the InvesTalks Stock Market Blog.
Deep Multi-Indicator Technical Deconstruction
Our multi-indicator setup indicates strengthening structural technical health heading into Wednesday, September 16, 2026:
1. Moving Average Convergence & Key EMA Reclaims
- 50-Day EMA (23,600): Nifty 50 achieved a clean daily closing cross above its 50-day EMA, confirming an ongoing bullish reversal.
- 20-Day EMA (23,540): Reclaimed earlier in the session, now acting as strong trailing intraday support.
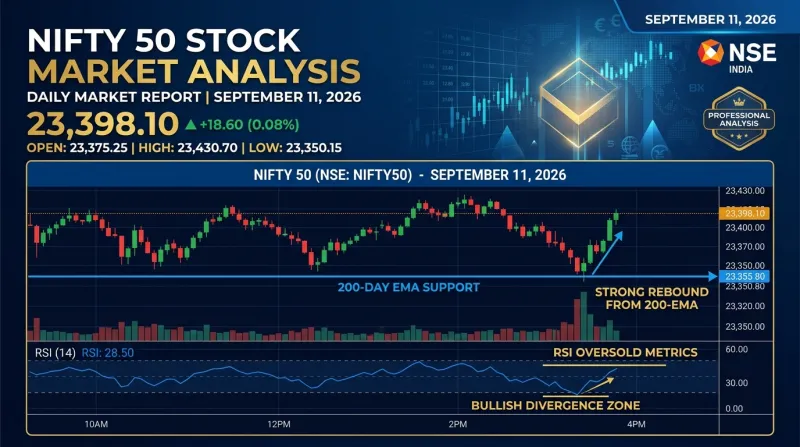
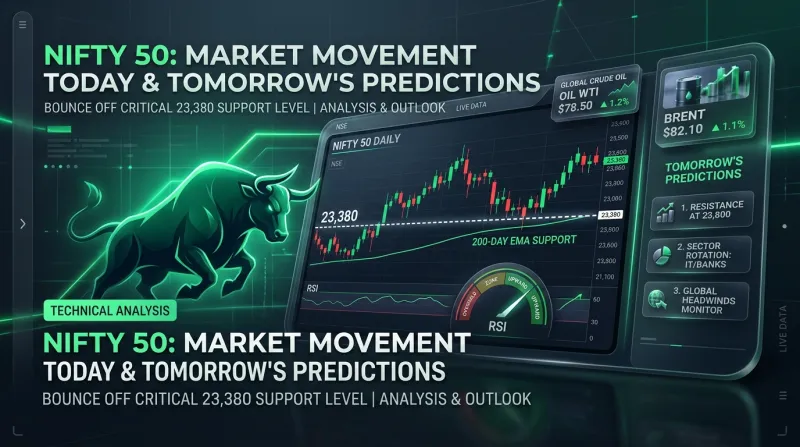
- 200-Day EMA (23,390): Solidified as the structural macro floor.
2. Relative Strength Index (RSI - 14 Days)
- Daily RSI expanded from oversold levels (30.50) up to 48.20, signaling a transition into a positive momentum zone without entering overbought territory. This leaves ample room for further upside move toward 23,750.
3. Central Pivot Range (CPR) for Wednesday, September 16
- Pivot Point (P): 23,585.50
- Bottom Central (BC): 23,605.10
- Top Central (TC): 23,565.90
- CPR Width: Average-to-Narrow CPR (~39 points). The price closing above the CPR TC level (23,565.90) indicates a bullish directional bias for Wednesday's opening session.
4. Option Chain Analysis & Put-Call Ratio (PCR)
- Put-Call Ratio (PCR): Shifted decisively to 1.12, reflecting aggressive Put writing and bullish positioning.
- Call Open Interest (Resistance): Highest Call OI concentrated at 23,700 CE (92 lakh shares) and 23,800 CE (1.05 crore shares).
- Put Open Interest (Support): Maximum Put OI positioned at 23,500 PE (1.15 crore shares) and 23,400 PE (88 lakh shares).
Nifty 50 Option Chain Open Interest DistributionCall OI (Resistance) Put OI (Support)[23,800 CE] ███████████████████ 105L[23,700 CE] ███████████████ 92L[23,650 CE] ████████ 48L---------------------- [23,610 SPOT] ----------------------████████████ 62L [23,600 PE]█████████████████████ 115L [23,500 PE]████████████████ 88L [23,400 PE]
Analyze live option chain heatmaps and PCR shifts on the InvesTalks Nifty Option Chain Screener.
Key Support & Resistance Level Grid for Wednesday, September 16, 2026
| Level Type | Price Level (Pts) | Technical Justification & Market Context |
|---|---|---|
| Resistance 3 (R3) | 23,850 | Upper Bollinger Band & Major Swing High Barrier |
| Resistance 2 (R2) | 23,750 | Psychological Resistance & Call Writing Wall |
| Resistance 1 (R1) | 23,680 | Immediate Intraday Breakout Trigger & High Extension |
| Pivot Point (P) | 23,585 | Daily Central Pivot Point & 50-Day EMA Confluence |
| Support 1 (S1) | 23,550 | 20-Day EMA Floor & CPR TC Boundary |
| Support 2 (S2) | 23,490 | Tuesday Intraday Demand Low |
| Support 3 (S3) | 23,380 | Structural 200-Day EMA Base Level |
Wednesday Market Predictions & Decision-Tree Scenarios (September 16, 2026)
Based on technical indicator alignment, we present three probabilistic trading scenarios for Wednesday, September 16, 2026:

Scenario A: Bullish Continuation Breakout (55% Probability)
- Trigger: A flat to positive opening allowing Nifty to trade above 23,610.
- Price Dynamics: Sustained buying pushes the index past immediate resistance at 23,680 (R1), forcing short-covering among call writers at 23,700 CE.
- Upside Targets: 23,680, extending toward 23,750 (R2).
Scenario B: Range-Bound Consolidation (30% Probability)
- Trigger: Flat global signals with index oscillating around the Central Pivot Range.
- Price Dynamics: Nifty 50 trades within a defined range between 23,530 and 23,650.
- Trading Action: Favorable for option sellers (straddle/strangle strategies).
Scenario C: Profit-Booking Pullback (15% Probability)
- Trigger: Sudden spike in crude oil prices or weakness in US equity futures.
- Price Dynamics: A break below 23,490 (S2) triggers profit-taking down toward the 200-day EMA.
- Downside Targets: 23,430, extending to 23,380 (S3).
Master technical analysis strategies with tools on the InvesTalks Technical Analysis Portal.
Actionable Strategy & Risk Management Guidelines
For Intraday & Swing Traders
- Bullish Trigger: Enter long positions on a 15-minute candle closing above 23,620, targeting 23,680 and 23,740. Maintain a stop-loss at 23,540.
- Pullback Buying: Look for dip-buying opportunities near 23,550 (S1) if bullish reversal signals form. Enforce a stop-loss below 23,480.
- Volatility Management: With India VIX cooling to 14.85, option buying setups carry lower volatility drag (vega decay).
For Long-Term Investors
- With Nifty successfully reclaiming its 50-day EMA and holding above the 200-day EMA floor, structural market strength remains intact. Continue systematic equity accumulation in fundamental large-cap leaders.
❓ Frequently Asked Questions (FAQs)
Nifty 50 closed at 23,610.45, up 88.30 points (+0.38%), after reaching an intraday high of 23,655.80.
Yes, Nifty 50 successfully crossed and closed above its 50-day EMA (23,600), confirming bullish trend continuation.
A Put-Call Ratio (PCR) of 1.12 indicates healthy bullish positioning, where Put writing outpaces Call writing, providing downside support.
Key support levels are S1: 23,550 (20-day EMA), S2: 23,490 (Tuesday low), and S3: 23,380 (200-day EMA).
Primary resistance levels are R1: 23,680, R2: 23,750 (Major Call OI barrier), and R3: 23,850 (Upper Bollinger Band).
Foreign Institutional Investors (FIIs) turned net buyers of +₹620.40 Crore, while DIIs bought equities worth +₹1,180.50 Crore.
A cooling India VIX (-2.75% to 14.85) signals reduced market anxiety, making option premiums more stable and favorable for directional setups.
The Central Pivot Point for Wednesday stands at 23,585.50, with a narrow CPR band extending between 23,565.90 and 23,605.10.
If Nifty sustains above 23,620 during early trade, a short-covering push past 23,680 can extend the rally toward 23,750.
Easing Brent Crude Oil prices down to $102.40/bbl and a softening US Dollar Index (103.85) provided macro relief to domestic equity sentiment.
Financial & Regulatory Disclaimer
InvesTalks provides stock market analysis, equity research, and financial content strictly for educational and informational purposes only. We are not a SEBI-registered investment advisor or portfolio manager. Market investments are subject to market risks. Always perform your own research or consult a certified SEBI-registered financial advisor before making buy/sell decisions.
Admin
Equity Research & Financial AnalysisCurated by the InvesTalks financial analysis team. Dedicated to providing disciplined stock market insights, technical chart evaluations, and long-term investor education.
 Market News & Outlook

Login to comment.