
Index
- Introduction
- Executive Market Scorecard: Thursday, September 10, 2026
- Key Macro Drivers Affecting Today's Session
- Multi-Timeframe Price Action Anatomy (Daily & 60-Min)
- Multi-Indicator Technical Analysis Deep-Dive
- Derivatives Architecture & Option Chain Open Interest (PCR 0.72)
- Sectoral Heatmap & Stock-Specific Outperformers
- Definitive Support & Resistance Grid for Friday, September 11, 2026
- Probabilistic Scenarios for Tomorrow (Friday, September 11, 2026)
Nifty 50 Analysis (Sept 10): 23,380 Bounce & Sept 11 Forecast
 By Admin
|
Sep 10, 2026
|
1 min read
|
5
|
🤍
0
By Admin
|
Sep 10, 2026
|
1 min read
|
5
|
🤍
0
The Indian equity benchmark Nifty 50 snapped its three-session losing streak on Thursday, September 10, 2026, gaining 46.30 points (+0.20%) to close at 23,477.80. The BSE Sensex similarly gained 138.36 points (+0.19%) to settle at 74,902.59.
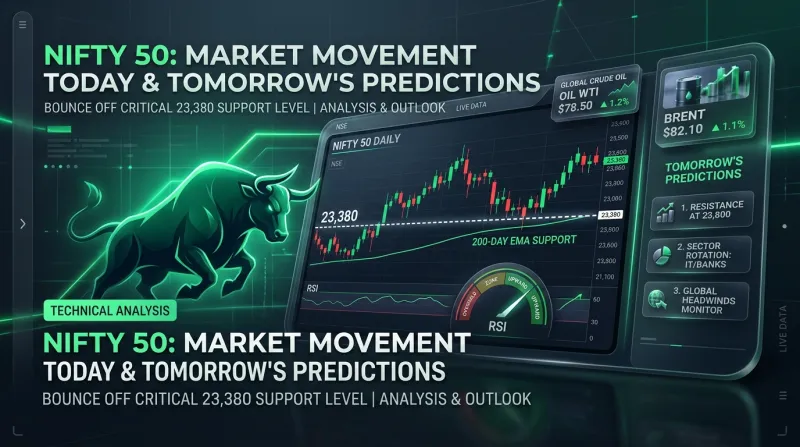
On a volatile weekly options expiry day, early intraday selling pushed the index to a low of 23,380.10. At this level, strong institutional buying defended the critical 200-day Exponential Moving Average (EMA) structural support floor at 23,380, sparking an impressive 114-point late-afternoon recovery to touch a session high of 23,494.95.
Outperformance in financial services, banking heavyweights (State Bank of India, ICICI Bank), Power Grid (+1.8%), and HDFC Life provided key support, offsetting selling pressure in IT majors (HCL Tech) and metal stocks (Nifty Metal -0.65%).
With the Daily RSI rebounding off sub-30 oversold territory (32.40) and Domestic Institutional Investors (DIIs) deploying +₹1,509 Crore in cash equities, technical indicators signal early signs of trend stabilization heading into Friday, September 11, 2026.
This comprehensive research report on Investalks.in provides a complete multi-indicator technical breakdown of Nifty 50 for Thursday, September 10, 2026, evaluating 200-Day EMA Support Dynamics, Bollinger Bands (20, 2), RSI (14), Moving Average Ribbons, CPR Pivots, Option Chain Architecture, and decision-tree probabilistic scenarios for tomorrow (Friday, September 11, 2026).
Executive Market Scorecard: Thursday, September 10, 2026
| Index Metric | September 10, 2026 Value | Previous Close | Net Change |
|---|---|---|---|
| Nifty 50 (NSE Spot) | 23,477.80 | 23,431.50 | +46.30 (+0.20%) 🟢 |
| BSE Sensex | 74,902.59 | 74,764.23 | +138.36 (+0.19%) 🟢 |
| Nifty Bank | 56,680.20 | 56,540.10 | +140.10 (+0.25%) 🟢 |
| Nifty Financial Services | 25,120.40 | 24,980.15 | +140.25 (+0.56%) 🟢 |
| Nifty Metal Index | 9,776.15 | 9,840.15 | -64.00 (-0.65%) 🔴 |
| India VIX (Volatility) | 12.10 | 12.45 | -0.35 (-2.81%) 📉 |
| NSE Market Breadth | Advances: 1,840 | Declines: 1,690 | Ratio: 1.09 (Pos) |
Key Macro Drivers Affecting Today's Session
MACRO CATALYSTS IMPACTING MARKET TODAY
200-Day EMA Defense ──► Buyers step in at 23,380 to snap 3-day losing streak.
Banking & Financial Support ──► HDFC Life, Power Grid & PSU Banks lead recovery.
Crude Oil Volatility ──► Brent crude near $92.50–$95.00/bbl caps upside momentum.
DII Inflow Buffer (+₹1,509 Cr) ──► Domestic funds absorb foreign portfolio net selling (-₹582 Cr).
- Defense of the 200-Day EMA (23,380): The primary technical driver was institutional buying at the 200-day Exponential Moving Average (23,380), which served as a major structural floor.
- Financials & Banking Recovery: Financial services (+0.56%) and banking stocks provided upward support, absorbing selling pressure in IT and metals.
- Institutional Capital Flows: Domestic Institutional Investors (DIIs) deployed a net +₹1,509.04 Crore in cash equities during the previous session, offsetting FII net selling (-₹582.99 Crore). Read detailed sector reports on Investalks.in Stock Analysis.
Multi-Timeframe Price Action Anatomy (Daily & 60-Min)
DAILY TIMEFRAME: GREEN PIERCING REVERSAL TAIL OFF 200-DAY EMA FLOOR
24,210 ── 20-Day EMA Overhead Barrier
23,820 ── 100-Day SMA Major Resistance
23,477 === SEPTEMBER 10 CLOSE: 23,477.80
23,380 ── Intraday Low (200-Day EMA Support Floor!)
- Daily Candlestick Pattern: The daily chart printed a Green Piercing Line / Bullish Reversal Candle with a lower shadow extending to 23,380.10.
- Structural Support Defense: Rebounding 114 points off the 200-day EMA (23,380) confirms that long-term structural buyers remain active at macro support levels.
Multi-Indicator Technical Analysis Deep-Dive
| Technical Indicator | Current Value / Setting | Historical Regime | Technical Signal |
|---|---|---|---|
| Bollinger Bands (20, 2) | Upper: 24,560 | Middle: 24,190 | Lower: 23,420 |
| %B Indicator | 0.092 | Rebounding Oversold | Rebound Posture 🟢 |
| RSI (14-Period, Daily) | 32.40 | Recovering Sub-35 | Bullish Reversal 🟢 |
| RSI (14-Period, 60-Min) | 41.20 | Turning Upward | Positive Divergence |
| 20-Day EMA | 24,210.00 | Price < 20 EMA | Major Supply Zone |
| 50-Day EMA | 24,120.00 | Price < 50 EMA | Major Ceiling |
| 100-Day EMA | 23,920.00 | Price < 100 EMA | Resistance Zone |
| 100-Day SMA | 23,820.00 | Price < 100 SMA | Immediate Hurdle |
| 200-Day EMA | 23,380.00 | Price > 200 EMA | Bedrock Bull Floor |
| MACD (12, 26, 9) | Line: -112.1 | Sig: -83.6 | Histogram: -28.50 | Shrinking Bars 🟢 |
| Daily CPR (Sept 11) | TC: 23,432 | P: 23,450 | BC: 23,468 | Width: ~36 points |
| India VIX | 12.10 | Low Volatility Tier | Volatility Easing 📉 |
1. 200-Day EMA Bedrock Support Defense (23,380)
- The 200-day Exponential Moving Average (23,380) is widely regarded by institutional portfolio managers as the primary trend floor for the long-term bull market. Today's intraday low (23,380.10) tested this level before attracting strong buying interest into the close.
2. Relative Strength Index (RSI 14) Analysis
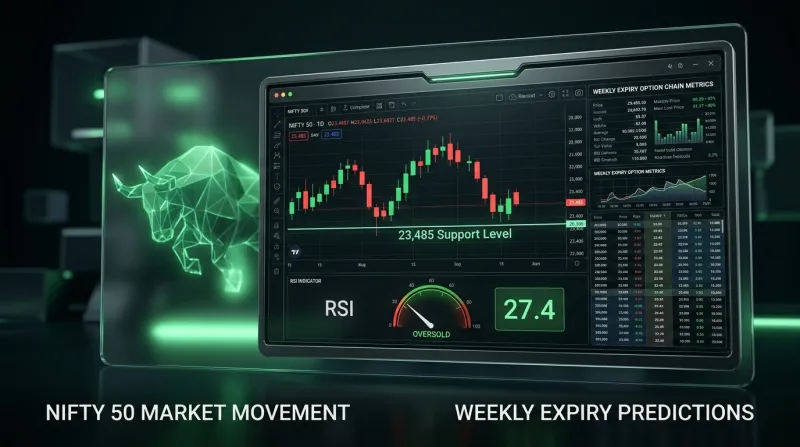
- Daily RSI (32.40): Rebound off sub-30 oversold levels (27.40 yesterday), indicating early stages of a technical recovery.
- 60-Minute RSI (41.20): Crossed back above the 40 mark, confirming hourly momentum improvement.
5. Central Pivot Range (CPR) for Tomorrow (Friday, September 11, 2026)
Calculations for Friday's session (September 11, 2026):
Derivatives Architecture & Option Chain Open Interest (PCR 0.72)
| Strike Price | Call Open Interest | Call Role | Put Open Interest | Put Role |
|---|---|---|---|---|
| 23,600 | 16.5M | Resistance Wall | — | — |
| 23,550 | 13.8M | Resistance Wall | — | — |
| 23,500 | 8.2M | Resistance Wall | — | — |
| 23,400 | — | — | 17.2M | Support Floor |
| 23,300 | — | — | 13.5M | Support Floor |
| 23,200 | — | — | 7.8M | Support Floor |
- Put-Call Ratio (PCR): 0.72 (Recovered from yesterday's extreme 0.58 oversold level).
- 23,400 PE Support Wall: Holds 17.2 Million contracts, establishing 23,400 as immediate support.
- 23,600 CE Call Wall: Holds 16.5 Million contracts, acting as overhead resistance.
- Max Pain Strike: Located at 23,500.
Sectoral Heatmap & Stock-Specific Outperformers
| Sector Index | Today's Change (%) | Technical Bias | Key Stocks |
|---|---|---|---|
| Nifty Financial Services | +0.56% 🟢 | Outperforming Support | HDFCLIFE, SBIN |
| Nifty Bank | +0.25% 🟢 | Rebound Base | ICICIBANK, KOTAK |
| Nifty Energy | +0.18% 🟢 | Steady Holding | ONGC, POWERGRID |
| Nifty FMCG | +0.10% 🟢 | Muted Positive | ITC, HINDUNILVR |
| Nifty IT | -0.35% 🔴 | Softening Drag | HCLTECH (-1.8%) |
| Nifty Metal | -0.65% 🔴 | Commodity Drag | HINDALCO, TATASTEEL |
Definitive Support & Resistance Grid for Friday, September 11, 2026
| Level Classification | Exact Price Zone | Confluence Factors |
|---|---|---|
| Major Resistance 3 (R3) | 23,660 – 23,680 | 23,650 CE + Daily R3 Pivot |
| Intermediate Resistance 2 | 23,550 – 23,565 | Max Pain 23,500 + Daily R2 Pivot |
| Immediate Resistance 1 | 23,495 – 23,520 | Thursday High + Daily R1 Pivot |
| Current Spot Price | 23,477.80 | Rebounded 114 Points Off 23,380 EMA Floor |
| Immediate Support 1 (S1) | 23,434 – 23,450 | Central Pivot (P) + CPR Base |
| Intermediate Support 2 (S2) | 23,380 – 23,400 | 200-Day EMA Floor + 23,400 PE Wall |
| Major Structural Base (S3) | 23,320 – 23,336 | Daily S2 Pivot |
Probabilistic Scenarios for Tomorrow (Friday, September 11, 2026)
| Scenario | Probability | Market Condition / Trigger | Target / Expected Range |
|---|---|---|---|
| Scenario A — Bullish Follow-Through | 50% | Breaks & Holds > 23,520 | 23,565 → 23,660 |
| Scenario B — Rebound Support Base Consolidation | 35% | Holds 23,400–23,450 Base | Range: 23,400–23,520 |
| Scenario C — Bearish Breakdown | 15% | Sustained Close < 23,380 | 23,320 → 23,220 |
🟢 Scenario A: Bullish Follow-Through Rebound (50% Probability)
- Pre-Conditions (September 11): Positive overnight Asian market cues, crude oil prices stabilizing below $92.50/bbl, and GIFT Nifty indicating a green open above 23,500.
- Technical Trigger: Nifty opens above the Central Pivot (23,450) and decisively crosses 23,520 (Thursday High & Daily R1) on a 15-minute closing candle.
- Upside Targets:
- Primary Target: 23,550 – 23,565 (Max Pain & Daily R2)
- Secondary Target: 23,660 – 23,680 (Daily R3)
- Technical Invalidation: A breakdown back below 23,400.
🟡 Scenario B: Support Base Consolidation & Range Trade (35% Probability)
- Pre-Conditions (September 11): Flat global market cues and muted morning opening.
- Technical Trigger: Nifty dips to retest the 23,400 – 23,450 support zone in morning trade, forming a bullish rejection candle (hammer/doji).
- Upside Target: Rebound back toward 23,495 and 23,520.
- Technical Invalidation: Sustained 15-minute trading below 23,380.
🔴 Scenario C: Bearish Breakdown Below 23,380 (15% Probability)
- Pre-Conditions (September 11): Geopolitical friction escalating, Brent crude surging past $95.00/bbl, or aggressive Call writing at 23,500 CE.
- Technical Trigger: A sustained 15-minute closing breakdown below 23,380 (200-Day EMA Floor & Thursday Low).
- Downside Targets:
- Primary Target: 23,320 – 23,336 (Daily S2 Pivot)
- Secondary Target: 23,221 (Daily S3 Pivot)
- Technical Invalidation: A quick V-shaped reclaim back above 23,450.
❓ Frequently Asked Questions (FAQs)
Nifty 50 rose 46.30 points (+0.20%), snapping a 3-day losing streak, as institutional buying defended the critical 200-day EMA support floor at 23,380, leading to an intraday recovery.
Technical analysis indicates a 50% probability of a bullish follow-through rebound toward 23,550–23,565, provided Nifty holds its 23,400–23,450 support base and crosses 23,520.
- Immediate Support: 23,434 – 23,450 (Central Pivot & CPR Base)
- Major Support: 23,380 – 23,400 (200-Day EMA Floor)
- Immediate Resistance: 23,495 – 23,520 (Thursday High & Daily R1)
- Major Resistance: 23,550 – 23,565 (Max Pain & Daily R2)
The 200-day Exponential Moving Average (EMA) is the primary trend floor for the macro bull market. Defending 23,380 confirms that long-term institutional buyers remain active.
Financial Services (+0.56%), Bank Nifty (+0.25%), and Energy (+0.18%) led today's recovery, supported by stocks like HDFC Life, Power Grid, and ONGC.
Domestic Institutional Investors (DIIs) net bought +₹1,509.04 Crore in cash equities on Sept 9, offsetting net selling by Foreign Institutional Investors (FIIs) of -₹582.99 Crore.
A PCR of 0.72 indicates a recovering sentiment from extreme oversold levels (0.58), offering potential for further short-covering gains.
HCL Tech, Hindalco, and Tata Steel were among the primary laggards today.
The next major resistance target above 23,565 sits at the 100-day SMA level near 23,820.
You can track live technical updates, daily CPR calculations, and stock market analysis on Investalks.in Market Wrap Hub.
Financial & Regulatory Disclaimer
InvesTalks provides stock market analysis, equity research, and financial content strictly for educational and informational purposes only. We are not a SEBI-registered investment advisor or portfolio manager. Market investments are subject to market risks. Always perform your own research or consult a certified SEBI-registered financial advisor before making buy/sell decisions.
Admin
Equity Research & Financial AnalysisCurated by the InvesTalks financial analysis team. Dedicated to providing disciplined stock market insights, technical chart evaluations, and long-term investor education.
 Market News & Outlook

Login to comment.