
Index
- Introduction
- 1. Executive Market Summary: August 19, 2026 Scorecard
- 2. Macro Catalysts & Institutional Flow Dynamics
- 3. Multi-Timeframe Price Action Anatomy (Daily, 60-Min, 15-Min)
- 4. Indicator-by-Indicator Technical Deconstruction
- 5. Derivatives Architecture: Option Chain, PCR & Open Interest Distribution
- 6. Sectoral Heatmap & Market Breadth Breakdown
- 7. Definitive Support & Resistance Mapping Grid
- 8. Probabilistic Movement Scenarios for Tomorrow's Session
- 9. Risk Architecture & Volatility Sizing Principles
- 10. Frequently Asked Questions (FAQs)
Nifty 50 technical analysis August 19 2026
 By Admin
|
Aug 19, 2026
|
1 min read
|
157
|
🤍
0
By Admin
|
Aug 19, 2026
|
1 min read
|
157
|
🤍
0
The Indian benchmark Nifty 50 concluded another turbulent session on Wednesday, August 19, 2026, slipping 76.60 points (-0.32%) to settle at 24,078.30. Today’s close officially marks the index’s seventh consecutive day of losses—its longest sustained losing streak in nearly a calendar year.
A relentless combination of external macroeconomic headwinds—including Brent crude oil surging toward $92 per barrel, heightened geopolitical tensions across the Middle East, rising global sovereign bond yields, and heavy distribution in frontline Energy and Power stocks—continued to suppress market sentiment. However, unlike prior sessions of aggressive institutional liquidation, today’s trading exhibited subtle signs of selling exhaustion, with Foreign Institutional Investors (FIIs) turning net buyers (+₹408 Cr) and the index repeatedly defending the critical 24,000–24,025 structural support cluster.
This comprehensive technical analysis provides an exhaustive multi-timeframe examination of the Nifty 50, integrating Classical Price Action Geometry, Bollinger Bands (20, 2), Volume Spread Analysis (VSA), Relative Strength Index (RSI 14), Moving Average Ribbons (EMA 20/50/100/200), Central Pivot Range (CPR), and Derivatives Option Chain metrics to define exact structural boundaries and map out probabilistic market movement scenarios for the upcoming weekly expiry session.
1. Executive Market Summary: August 19, 2026 Scorecard
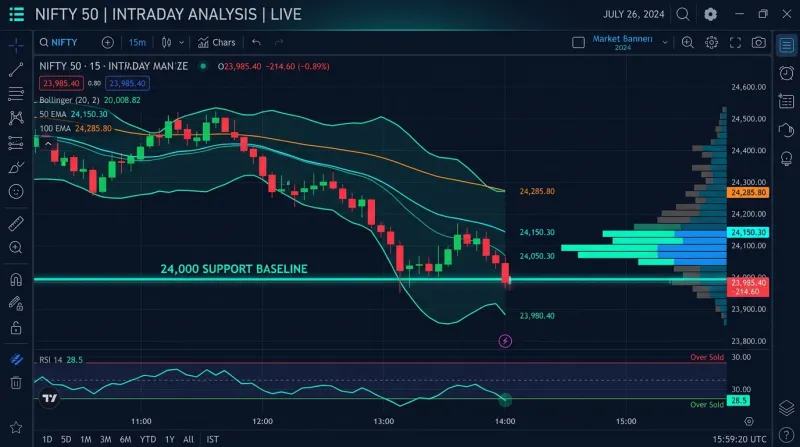
The Nifty 50 opened Wednesday’s session at 24,142.10, briefly attempted an early rally to an intraday high of 24,172.85, and drifted lower under the weight of selling in heavyweights like Coal India, Power Grid, and Reliance Industries to print an intraday low of 24,025.65 before stabilizing above the 24,050 zone to settle at 24,078.30.
| Index / Metric | August 19, 2026 Value | Previous Close | Net Change | Direction |
|---|---|---|---|---|
| Nifty 50 (NSE Spot) | 24,078.30 | 24,198.60 | -76.60 (-0.32%) | 🔴 |
| BSE Sensex | 76,909.68 | 77,364.20 | -325.78 (-0.42%) | 🔴 |
| Nifty Bank | 57,239.75 | 57,180.45 | -22.65 (-0.04%) | 🟢 |
| Nifty Midcap 100 | 57,890.40 | 58,012.80 | -122.40 (-0.21%) | 🔴 |
| Nifty Smallcap 100 | 18,335.80 | 18,430.15 | -94.35 (-0.51%) | 🔴 |
| India VIX | 12.14 | 11.78 | +0.36 (+3.06%) | 📈 |
| NSE Advance/Decline | Advances: 965 | Declines: 1,611 | Ratio: 0.60 (Weak) | 🔴 |
The total intraday swing expanded to 147.20 points, reflecting intensified battle lines between dip buyers defending the 24,000 psychological threshold and short sellers defending overhead intraday supply zones.
2. Macro Catalysts & Institutional Flow Dynamics
A complete technical framework requires contextualizing price action within the prevailing liquidity environment:
🛢️ BRENT CRUDE
~$92 / bbl
│
▼
DOMESTIC INFLATION CONCERNS
Higher energy & input costs
│
▼
ENERGY / FMCG SELLING
Margin & demand pressure
🇺🇸 US 10Y YIELDS
4.41%
│
▼
GLOBAL RISK-OFF POSTURING
Defensive investor stance
│
▼
7-DAY NIFTY CONSOLIDATION
Range-bound market action
[ US 10Y Yields: 4.41% ] ───► [ Global Risk-Off Posturing ] ───► [ 7-Day Nifty Consolidation ]
A. Energy Volatility: Brent Crude at $92/bbl
Brent crude futures extended their upward trajectory, climbing toward 91.80–91.80–92.10 per barrel. High crude oil prices act as a direct margin headwind for Indian manufacturing, logistics, and paints, while increasing the nation's import bill and putting pressure on the Indian Rupee.
B. Shift in Institutional Participation (FII vs. DII)
- FII Net Cash Position: Following several consecutive sessions of aggressive net selling, Foreign Institutional Investors turned net buyers of +₹408.00 Crore in the cash market, indicating that foreign selling velocity has reached a point of temporary deceleration.
- DII Net Cash Position: Domestic Institutional Investors maintained strong continuous buying, absorbing +₹3,973.70 Crore in cash equities.
Key Observation: Domestic institutions have deployed over ₹13,000+ Crore in net liquidity over the past three sessions alone, creating a robust capital buffer around the 24,000 benchmark.
3. Multi-Timeframe Price Action Anatomy (Daily, 60-Min, 15-Min)
Observing price action across multiple timeframes reveals how higher-timeframe trends interact with intraday micro-auctions.
DAILY TIMEFRAME: TESTING THE MAJOR 100 EMA & 24,000 BEDROCK
24,850 = ▼ (Lower High 1)
24,580 = ▼ (Lower High 2)
24,360 = ▼ (Lower High 3)
24,198 = ▼ (Lower High 4)
24,078 =========[ TODAY'S CLOSE: 24,078.30 ]
24,000 ──────── 100-Day EMA Demand Base
A. Daily Timeframe Analysis: Candlestick Rejection at Key Demand Base
- Candlestick Morphology: The daily chart printed a bearish candle characterized by a notable lower wick (rejection tail). The intraday low of 24,025.65 was immediately rejected with high buying volume, demonstrating strong institutional absorption ahead of the round figure of 24,000.
- Descending Channel Support: The lower boundary of the falling channel initiated from the 24,850 swing high aligns precisely at the 24,000–24,030 zone. Today's bounce from 24,025 confirms that technical algorithms are actively respecting this lower channel rail.
- The 7-Day Consecutive Down Trend: Statistically, 7 consecutive red days in the Nifty 50 is an extreme historical rarity (occurring fewer than 5 times in the last decade). In each prior historical instance, the 7th or 8th day marked an inflection point that produced a sharp multi-day mean-reversion counter-trend rally.
B. 60-Minute (Hourly) Timeframe: Liquidity Sweeps & Value Imbalances
- Liquidity Sweep at 24,025: During the 13:00–14:00 hourly block, the index swept the previous week's liquidity pool below 24,100, triggered retail stop-loss orders, and immediately rebounded back inside the value zone.
- Overhead Supply Blocks (Hourly Order Blocks): The primary hourly supply block is positioned between 24,220 and 24,260. Until the hourly chart registers a decisive close above 24,260, intermediate rallies remain classified as corrective pullbacks within a broader downtrend.
C. 15-Minute Intraday Microstructure
- 09:15 – 10:15: Initial price discovery faced immediate supply at 24,172, setting up a lower high compared to yesterday's 24,266 high.
- 10:30 – 13:45: Steady downward drift below VWAP, culminating in an aggressive sell-off toward the day's low of 24,025.
- 14:00 – 15:30: Dynamic recovery leg where the index surged 60+ points from the low to settle comfortably above 24,070, indicating active short-covering into the closing bell.
4. Indicator-by-Indicator Technical Deconstruction
Below is an exhaustive breakdown of core technical indicators on the daily and hourly timeframes.
| Technical Indicator | Current Value / Setting | Historical Regime | Technical Signal |
|---|---|---|---|
| Bollinger Bands (20, 2) | Upper: 24,760Middle: 24,395Lower: 24,030 | — | — |
| BB Bandwidth (BBW) | 3.12% | High Expansion | 🔴 Extended Downtrend |
| %B Indicator | 0.065 | Extreme Lower Band | 🔴 Deeply Oversold |
| RSI (14-Period, Daily) | 36.40 | Approaching Oversold | 🟡 Near Reversal Zone |
| RSI (14-Period, 60-Min) | 31.10 | Deep Oversold Regime | 🟢 Strong Divergence |
| 20-Day EMA | 24,410.20 | Price < 20 EMA | 🔴 Bearish Trend |
| 50-Day EMA | 24,228.40 | Price < 50 EMA | 🔴 Major Supply Zone |
| 100-Day EMA | 23,995.10 | Price > 100 EMA | 🟢 Crucial Support |
| 200-Day EMA | 23,340.00 | Price > 200 EMA | 🟢 Structural Bull |
| MACD (12, 26, 9) | Line: -84.10Signal: -48.00Histogram: -36.10 | Extended Momentum | 🔴 Bearish Momentum |
| Daily CPR (Tomorrow) | TC: 24,135P: 24,092BC: 24,049 | Narrow | 🟡 Breakout Potential |
| India VIX | 12.14 | Low-to-Moderate Tier | 🟡 Range Expansion |
A. Bollinger Bands (20, 2) & Volatility Bandwidth Analysis
BOLLINGER BANDS (20, 2) DAILY STRUCTURAL POSTURE
24,760 ----------Upper Band (+2σ)
\
24,395 ----------- 20 SMA Midline (Primary Mean-Reversion Target)
\
24,078 ========= [ CURRENT SPOT: 24,078.30 ]
\
24,030 ------------------Lower Band (-2σ)
The %B Reading at 0.065: The %B metric measures where price is relative to the bands:
%B=Price−Lower BandUpper Band−Lower Band=24,078.30−24,03024,760−24,030≈0.065%B=Upper Band−Lower BandPrice−Lower Band=24,760−24,03024,078.30−24,030≈0.065
A %B below 0.10 indicates that price is hugging the absolute floor of the statistical distribution. Such low readings rarely sustain for more than 2–3 sessions without a mean-reverting reversion toward the 20-day SMA midline (24,395).
- Lower Band Tag and Bounce: Today’s low of 24,025 tagged the lower band (24,030) and closed above it. This confirms that the Lower Band is actively functioning as a dynamic volatility support cushion.
B. Volume Spread Analysis (VSA) & Volume Profile Metrics
VOLUME PROFILE STRUCTURE (CURRENT AUGUST SERIES)
24,550 ─────────────── [ VAH: Value Area High ]
24,420 ▓▓▓▓▓▓▓▓▓▓▓▓▓▓▓ [ High Volume Node ]
24,280 ▓▓▓▓▓▓▓▓▓▓▓▓▓▓▓[ POC: Point of Control ]
24,080 ▓▓▓▓▓▓▓▓▓ [ Current Volume Accumulation ]
23,980 ───────────────[ VAL: Value Area Low ]
- Point of Control (POC): Sits higher at 24,280. Price trading below POC maintains a short-term bearish value bias, but the distance between current spot (24,078) and POC (24,280) creates a 200-point vacuum that can be rapidly filled during a short-covering squeeze.
- Value Area Low (VAL): Sits at 23,980, coinciding with the 100-day Exponential Moving Average.
- Volume Spread Behavior: Volume expanded by 18% over yesterday’s volume, particularly during the 14:00–15:30 recovery leg. An expansion of volume on a lower-wick rejection candle represents "Stopping Volume" in classical VSA principles, signaling that smart money is actively absorbing retail panic selling.
C. Relative Strength Index (RSI 14) Oversold Analysis
RSI (14) MOMENTUM GAUGES
70 ─────────────── Overbought Line
50 ─────────────── Equilibrium Threshold
36.40 ============= [ DAILY RSI: 36.40 ]
31.10 ============= [ 60-MIN RSI: 31.10 ] (Deep Oversold)
30 ─────────────── Oversold Boundary
- Daily RSI (36.40): The daily RSI has compressed into the mid-30s—its lowest momentum reading in five months.
- 60-Minute Positive Divergence: While Nifty broke below Tuesday’s low to print 24,025 today, the hourly RSI registered 31.10, notably higher than its reading of 28.40 recorded during earlier sell-offs this week. This prominent Class-A Bullish Momentum Divergence across hourly timeframes signals that the downward velocity is exhausted.
D. Exponential Moving Average (EMA) Ribbon Alignment
PRICE POSITION RELATIVE TO KEY MOVING AVERAGES
24,410.20 ─────────── 20-Day EMA (Short-Term Resistance)
24,228.40 ─────────── 50-Day EMA (Intermediate Ceiling)
24,078.30 =========== [ CURRENT SPOT: 24,078.30 ]
23,995.10 ─────────── 100-Day EMA (Major Bedrock Support)
23,340.00 ─────────── 200-Day EMA (Macro Structural Floor)
- The 100-Day EMA Buffer: The 100-day EMA is currently ascending through 23,995.10. The Nifty 50 has not closed below its 100-day EMA in over 240 trading sessions. This makes the 23,980–24,000 corridor the primary line in the sand for long-term structural bulls.
- The 50-Day EMA Overhead: The 50 EMA (24,228.40) now serves as the immediate hurdle that bulls must reclaim to neutralize the multi-day downtrend.
E. MACD (12, 26, 9) Momentum Deceleration
- MACD Line: Sits at -84.10 vs Signal Line at -48.00.
- Histogram: At -36.10, the MACD histogram has reached a deeply extended negative displacement, typical of mature corrections that precede explosive mean-reversions.
F. Central Pivot Range (CPR) & Classical Pivot Geometry
The mathematical CPR calculation for tomorrow's session (August 20, 2026):
Pivot (P)=High+Low+Close3=24,172.85+24,025.65+24,078.303≈24,092.25Pivot (P)=3High+Low+Close=324,172.85+24,025.65+24,078.30≈24,092.25
Bottom Central (BC)=High+Low2=24,172.85+24,025.652≈24,099.25Bottom Central (BC)=2High+Low=224,172.85+24,025.65≈24,099.25
Top Central (TC)=(Pivot−BC)+Pivot≈24,085.25Top Central (TC)=(Pivot−BC)+Pivot≈24,085.25
| Pivot Level | Price (Points) | Technical Significance |
|---|---|---|
| Resistance 3 (R3) | 24,372.50 | Extreme Bullish Expiry Extension |
| Resistance 2 (R2) | 24,239.45 | 50-Day EMA & Major Supply Zone |
| Resistance 1 (R1) | 24,158.85 | Intraday High & Value Resistance |
| Central Pivot (P) | 24,092.25 | Session Equilibrium / Fair Value |
| Support 1 (S1) | 24,011.65 | Today's Low & 24,000 Buffer Zone |
| Support 2 (S2) | 23,945.05 | 100-Day EMA Breach / Fib 61.8% |
| Support 3 (S3) | 23,864.45 | Extreme Bearish Extension Level |
Crucial Insight on Tomorrow's CPR: Tomorrow's CPR bandwidth is Extremely Narrow (only 14 points wide). In classical market profiling, a narrow CPR preceded by multi-day range contraction predicts a High-Probability Trending Day / Volatility Expansion Day.
5. Derivatives Architecture: Option Chain, PCR & Open Interest Distribution
Derivative positions for the weekly options expiry illustrate the psychological positioning of institutional option writers:
WEEKLY OPTION OPEN INTEREST DISTRIBUTION
CALL OPEN INTEREST (Resistance Walls) PUT OPEN INTEREST (Support Floors)
24,400 CE: ▓▓▓▓▓▓▓▓▓▓▓▓▓▓▓▓▓▓▓▓▓▓ (10.8M)
24,300 CE: ▓▓▓▓▓▓▓▓▓▓▓▓▓▓▓▓▓▓▓▓▓▓▓▓ (12.2M)
24,200 CE: ▓▓▓▓▓▓▓▓▓▓▓▓▓▓▓▓▓▓▓▓▓▓▓▓▓▓▓▓ (14.5M)24,200 PE: ▓▓▓▓▓▓▓▓ (4.2M)
24,100 CE: ▓▓▓▓▓▓▓▓▓▓▓▓▓▓ (7.1M) 24,100 PE: ▓▓▓▓▓▓▓▓▓▓▓▓ (6.1M)
24,000 PE: ▓▓▓▓▓▓▓▓▓▓▓▓▓▓▓▓▓▓▓▓▓▓▓▓▓▓▓▓▓▓ (15.8M)
23,900 PE: ▓▓▓▓▓▓▓▓▓▓▓▓▓▓▓▓ (8.4M)
A. Put-Call Ratio (PCR) Deep Divergence
- Current Total OI PCR: 0.68
- Interpretation: A PCR reading of 0.68 represents a severe oversold extreme. Historically, when Nifty PCR drops below 0.70, option writing on the call side becomes crowded. Any sudden upward price movement of 40–50 points forces call sellers to cover their short positions rapidly, creating the classic "Short Squeeze Gamma Spike".
B. The 24,000 Put Fortress vs. The 24,200 Call Wall
- The 24,000 PE Strike: Holds a massive 15.8 Million open contracts, making it the single largest concentration of Put Open Interest across the entire option chain.
- The 24,200 CE Strike: Sits with 14.5 Million open contracts, defining the immediate upper ceiling for tomorrow's session.
- Max Pain Strike: Currently stands at 24,200, indicating an upward gravitational pull of approximately 120 points from current spot levels.
6. Sectoral Heatmap & Market Breadth Breakdown
| Sector Index | Today's Change (%) | Technical Bias | Key Stocks |
|---|---|---|---|
| Nifty IT | +0.64% 🟢 | Outperforming Bounce | HCLTECH, INFY, TCS |
| Nifty Pharma | +0.28% 🟢 | Defensive Holding | SUNPHARMA, CIPLA |
| Nifty Financial Services | -0.12% 🔴 | Consolidation Base | HDFCBANK, AXISBANK |
| Nifty Auto | -0.38% 🔴 | Neutral Correction | M&M, BAJAJ-AUTO |
| Nifty FMCG | -0.74% 🔴 | Margin Pressure | ITC, NESTLEIND |
| Nifty Metal | -0.85% 🔴 | Global Commodity Lag | JSWSTEEL, HINDALCO |
| Nifty Energy | -1.45% 🔴 | Heavy Selling Drag | COALINDIA, NTPC |
- The IT Revival: The IT sector staged a notable decoupling today, gaining +0.64% led by HCL Tech (+2.06%) and Infosys (+0.85%), absorbing significant downside momentum from the broader index.
- Energy Drag: The state-run energy and power sector experienced severe institutional distribution, accounting for more than 60% of today’s net index points drop.
7. Definitive Support & Resistance Mapping Grid
| Level Classification | Exact Price Zone | Confluence Factors |
|---|---|---|
| 🔴 Major Resistance 3 (R3) | 24,380 – 24,410 | 20-Day EMA + 20-Day SMA Midline + Daily R3 |
| 🟠 Intermediate Resistance 2 (R2) | 24,230 – 24,260 | 50-Day EMA + Max Pain + Hourly Supply Block |
| 🟡 Immediate Resistance 1 (R1) | 24,140 – 24,175 | Day's High + Pivot R1 + 24,100 CE Zone |
| CURRENT SPOT PRICE | 24,078.30 | Testing 24,000 Lower Value Rail |
| 🟢 Immediate Support 1 (S1) | 24,010 – 24,025 | Today's Low + Lower Bollinger Band + S1 |
| 🟢 Structural Demand Base (S2) | 23,980 – 24,000 | 100-Day EMA + 15.8M Put Open Interest Wall |
| 🔵 Major Breakdown Base (S3) | 23,880 – 23,920 | Macro 0.618 Fibonacci Retracement Level |
8. Probabilistic Movement Scenarios for Tomorrow's Session
| Scenario | Probability | Market Condition | Trigger / Confirmation | Target / Expected Outcome |
|---|---|---|---|---|
| 🟢 Scenario A — Relief Pullback / Squeeze | 50% | Bullish recovery | Reclaims 24,140 with strong volume | 24,230 → 24,300 |
| 🔴 Scenario B — Breakdown | 30% | Bearish continuation | Sustained close below 23,980 | 23,900 → 23,850 |
| 🟡 Scenario C — Pinning Consolidation | 20% | Range-bound | Chops within 24,020–24,160 | 24,100 straddle decay |
Market Open: 09:15 AM
Base-case scenario: 🟢 Scenario A — Relief Pullback / Squeeze (50%)
🟢 Scenario A: Short-Covering Relief Pullback / Squeeze (50% Probability)
- Pre-Conditions: Muted overnight crude oil prices, stability in US equity futures, and GIFT Nifty indicating a flat-to-green opening.
- Technical Trigger: Nifty opens near or above the Central Pivot (24,092) and decisively breaks above 24,140–24,175 within the first 45 minutes of trade with expanding volume.
- Structural Targets:
- Primary Objective: 24,230 – 24,260 (50-Day EMA and Max Pain Node)
- Secondary Extension: 24,310 – 24,350 (Point of Control & Major Hourly Order Block)
- Technical Invalidation: A failure to sustain above 24,040 invalidates the short-covering setup.
🔴 Scenario B: Structural Breakdown Below 23,980 (30% Probability)
- Pre-Conditions: Fresh geopolitical escalation in the Middle East, Brent crude exceeding $93, or aggressive morning call writing at 24,100 CE.
- Technical Trigger: A sustained 15-minute candle close below the 23,980 (100-Day EMA) line with heavy institutional volume.
- Structural Targets:
- Primary Objective: 23,920 (Immediate Liquidity Pool)
- Secondary Extension: 23,850 – 23,880 (Major Fibonacci 61.8% Structural Base)
- Technical Invalidation: A rapid V-shaped reclaim back above 24,025.
🟡 Scenario C: Expiry Range Pinning & Volatility Compression (20% Probability)
- Pre-Conditions: Indecisive global cues and balanced option writing across 24,000 PE and 24,200 CE.
- Technical Dynamics: The index remains confined inside a strict 24,020 to 24,160 corridor, allowing option sellers to harvest maximum premium decay (Theta) on both call and put strikes heading into the 15:30 closing auction.
9. Risk Architecture & Volatility Sizing Principles
- Expiry Day Gamma Awareness: Because tomorrow is weekly expiry, Out-of-the-Money (OTM) options carry rapid theta erosion. Sudden intraday swings near the 24,000 strike can trigger significant gamma expansion.
- Narrow CPR Volatility Protocol: As tomorrow's CPR is exceptionally narrow (14 points), traders should anticipate a directional breakout attempt between 10:30 AM and 13:30 PM.
- Respecting the 100 EMA: The 100-day EMA (23,995) is the primary trend-defining benchmark on the daily timeframe; managing risk around this boundary is essential for capital preservation.
10. Frequently Asked Questions (FAQs)
1. Why did the Nifty 50 fall for the 7th consecutive day?
The index faced pressure due to rising Brent crude oil prices ($92/barrel), geopolitical tensions in the Middle East, high US bond yields (4.41%), and sharp profit booking in the Energy, Power, and FMCG sectors.
2. Is the 24,000 level a strong support for Nifty?
Yes. The 24,000 level represents a powerful structural confluence: the rising 100-day Exponential Moving Average (23,995), the lower rail of the falling channel, and the largest Put Open Interest concentration (15.8 Million contracts) on the options chain.
3. What does the Put-Call Ratio (PCR) of 0.68 indicate?
A PCR of 0.68 places the market in deep oversold territory. This indicates that call writing is crowded, which historically creates favorable statistical conditions for a sharp short-covering rally if overhead resistance levels are cleared.
4. Which sectors showed strength in today's market?
The Nifty IT index (+0.64%) and Nifty Pharma (+0.28%) demonstrated strong resilience and decoupled from broader market weakness, driven by gains in stocks like HCL Technologies and Sun Pharma.
Financial & Regulatory Disclaimer
InvesTalks provides stock market analysis, equity research, and financial content strictly for educational and informational purposes only. We are not a SEBI-registered investment advisor or portfolio manager. Market investments are subject to market risks. Always perform your own research or consult a certified SEBI-registered financial advisor before making buy/sell decisions.
Nifty 50 In-Depth Technical Analysis 18 August 2026
NEXTNifty 50 Consolidates Gains 21 August 2026 : In-Depth Techni...
Admin
Equity Research & Financial AnalysisCurated by the InvesTalks financial analysis team. Dedicated to providing disciplined stock market insights, technical chart evaluations, and long-term investor education.
 Market News & Outlook
Login to comment.