
Index
- Introduction
- 1. Executive Market Summary: August 18, 2026 Scorecard
- 2. Macro & Intermarket Backdrop: Global Catalysts & Institutional Flows
- 3. Multi-Timeframe Price Action Anatomy (Daily, 60-Min, 15-Min)
- 4. Indicator-by-Indicator Technical Deconstruction
- 6. Sectoral Performance & Market Breadth Dynamics
- 7. Definitive Support and Resistance Mapping Grid
- 8. Probabilistic Scenarios for Tomorrow's Session
- 9. Risk Architecture & Volatility Sizing Principles
- 10. Frequently Asked Questions (FAQs)
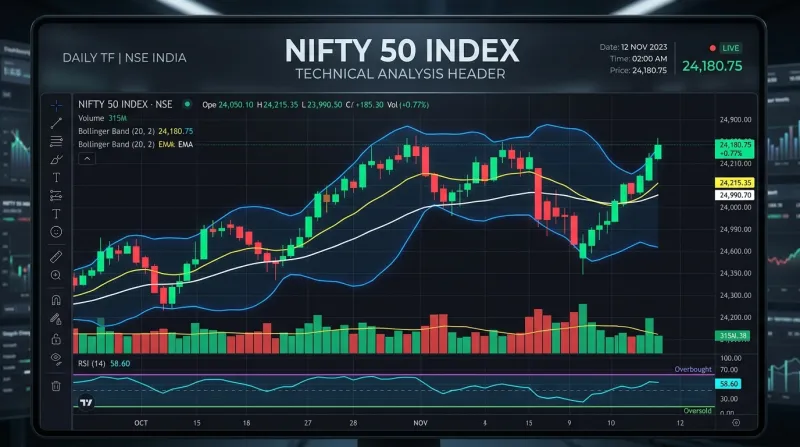
Nifty 50 In-Depth Technical Analysis 18 August 2026
 By Admin
|
Aug 18, 2026
|
1 min read
|
195
|
🤍
0
By Admin
|
Aug 18, 2026
|
1 min read
|
195
|
🤍
0
The Indian equity benchmark Nifty 50 concluded another volatile and technically significant trading session on Tuesday, August 18, 2026, slipping 0.37% to settle at 24,198.60. Today’s session marked the sixth consecutive day of downward pressure on frontline indices, as geopolitical tensions in the Middle East, surging global energy prices (with Brent crude climbing above $91/barrel), and relentless Foreign Institutional Investor (FII) outflows continued to cast a shadow over equity valuations.
For systematic traders, quantitative analysts, and price-action practitioners, today's price behavior provided critical clues about institutional order flow, volatility expansion, and structural key zones. The index repeatedly tested the lower boundaries of its intermediate demand zones, triggering intense positioning across options contracts.
This comprehensive technical dossier provides an exhaustive multi-timeframe breakdown of the Nifty 50, integrating classical Price Action Geometry, Bollinger Bands (20, 2), Volume Spread Analysis (VSA), Relative Strength Index (RSI 14), Moving Average Ribbons (EMA 20/50/100/200), Central Pivot Range (CPR), and Derivatives Option Chain metrics to define exact structural support and resistance levels and map out probabilistic market movement scenarios for the upcoming session.
1. Executive Market Summary: August 18, 2026 Scorecard
The Nifty 50 opened Tuesday’s session with a negative gap at 24,250.10, briefly touched an intraday high of 24,266.85, and drifted steadily lower to record an intraday low of 24,174.50 before making a minor late-afternoon recovery to close at 24,198.60.
| INDEX METRIC | AUGUST 18, 2026 VALUE | PREVIOUS CLOSE | NET CHANGE |
|---|---|---|---|
| Nifty 50 (NSE Spot) | 24,198.60 | 24,287.65 | -89.05 (-0.37%) 🔴 |
| BSE Sensex | 77,364.20 | 77,728.16 | -363.96 (-0.47%) 🔴 |
| Nifty Bank | 57,180.45 | 57,497.80 | -317.35 (-0.55%) 🔴 |
| Nifty Midcap 100 | 58,012.80 | 58,185.30 | -172.50 (-0.30%) 🔴 |
| Nifty Smallcap 100 | 18,430.15 | 18,476.60 | -46.45 (-0.25%) 🔴 |
| India VIX (Volatility) | 11.78 | 11.42 | +0.36 (+3.15%) 📈 |
| NSE Market Breadth | Advances: 842 | Declines: 1,514 | Ratio: 0.55 (Weak) |
Today's intraday range was compressed into 92.35 points, reflecting hesitation among market participants as the index hovers at a multi-week liquidity inflection zone.
2. Macro & Intermarket Backdrop: Global Catalysts & Institutional Flows
Technical patterns do not exist in a vacuum; they are heavily influenced by the macroeconomic liquidity environment:
GLOBAL MACRO INTERCONNECTIVITY MATRIX
[ Brent Crude: >$91/bbl ] ───► [ High Import Bill / INR Weakness ] ───► [ FII Outflows: ₹2.5k+ Cr ]
│
[ US 10Y Yields: 4.38% ] ───► [ Risk-Off Asset Reallocation ] ───► [ Nifty Range Compression ]
A. Geopolitical Pressure & Crude Spike
Brent crude futures surged above $91.20 per barrel following heightened military posturing in the Middle East. For an energy-import-dependent economy like India, elevated oil prices act as a direct margin headwind for consumer, paint, airline, and FMCG sectors, while exerting depreciating pressure on the Indian Rupee (USD/INR hovered near 83.95).
B. Sovereign Bond Yields & The Dollar Index (DXY)
The US 10-Year Treasury Yield held firm near 4.38%, while the US Dollar Index (DXY) traded near 104.40. High risk-free rates in developed markets continue to disincentivize aggressive capital deployment into emerging market equities.
C. Institutional Liquidity Divergence (FII vs. DII)
- FII Net Cash Position: Foreign Portfolio Investors remained net sellers across Indian cash equities, offloading approximately ₹2,180 Crore in today's session.
- DII Net Cash Position: Domestic Institutional Investors maintained an aggressive absorption stance, injecting +₹3,940 Crore into cash equities, effectively preventing a freefall in benchmark indices.
3. Multi-Timeframe Price Action Anatomy (Daily, 60-Min, 15-Min)
DAILY TIMEFRAME: DESCENDING CHANNEL / 100 EMA TEST
24,800 ───────┐
▼ (Lower High 1)
24,550 ──────────────┐
▼ (Lower High 2)
24,360 ─────────────────────┐
▼ (Lower High 3)
24,198 ===================== [ TODAY'S CLOSE: 24,198.60 ]
24,000 ─────────────────────────────────────────────────── Major Demand Zone / 100 EMA
A. Daily Timeframe Analysis: Structural Degradation & Support Confluence
- Candlestick Morphology: The daily candle printed a moderate-bodied bearish candlestick with minor upper and lower wicks, confirming that while selling pressure dominated the session, aggressive dumping was met with dip-buying around the 24,175 level.
- Lower High / Lower Low Sequence: Since touching its recent peak near 24,850, the Nifty 50 has formed a persistent series of descending peaks on the daily timeframe:
- Peak 1: 24,850
- Peak 2: 24,580
- Peak 3: 24,360
- Trendline Dynamics: The lower descending trendline connecting previous swing lows aligns precisely between 24,120 and 24,150, making this zone a structural barrier against immediate breakdown.
B. 60-Minute (Hourly) Timeframe: Fair Value Gaps (FVG) & Order Blocks
- Bearish Order Block (OB): The supply zone created on Monday between 24,340 and 24,380 acted as a rejection ceiling during early morning attempts to push higher.
- Fair Value Gap (FVG): An unfilled liquidity imbalance exists on the 1-hour chart between 24,320 and 24,360. In technical auction theory, markets tend to gravitate toward unfilled FVGs prior to making subsequent directional legs.
C. 15-Minute Intraday Microstructure: The Auction Profile
- The Opening Phase (09:15 – 09:45): Nifty opened flat-to-negative and established an initial 15-minute range between 24,220 (Low) and 24,266 (High).
- The Mid-Day Drift (10:00 – 13:30): The index broke below the opening range low, trading in a tight 30-point drift below the Volume Weighted Average Price (VWAP).
- The Closing Auction (14:30 – 15:30): A late attempt to probe below 24,175 was absorbed by institutional block buyers, causing the final 15-minute candle to close near the midpoint of the day's total range.
4. Indicator-by-Indicator Technical Deconstruction
Below is an in-depth mathematical and visual evaluation of the primary technical indicators governing the Nifty 50 index.
| TECHNICAL INDICATOR | CURRENT VALUE / SETTING | HISTORICAL REGIME | TECHNICAL SIGNAL |
|---|---|---|---|
| Bollinger Bands (20, 2) | Upper: 24,785 | Middle: 24,420 | Lower: 24,055 |
| BB Bandwidth (BBW) | 3.01% | Expanding (Volatility) | Bearish Expansion |
| RSI (14-Period, Daily) | 41.20 | Sub-50 Bearish Regime | Neutral-Oversold |
| RSI (14-Period, 60-Min) | 37.85 | Approaching Oversold | Bullish Divergence |
| 20-Day EMA | 24,435.10 | Price < 20 EMA | Short-Term Bearish |
| 50-Day EMA | 24,240.50 | Price < 50 EMA | Intermediate Break |
| 100-Day EMA | 23,980.20 | Price > 100 EMA | Long-Term Bullish |
| 200-Day EMA | 23,310.00 | Price > 200 EMA | Structural Bullish |
| MACD (12, 26, 9) | Line: -62.40 | Sig: -38 | Histogram: -24.40 | Bearish Momentum |
| Daily CPR | TC: 24,248 | P: 24,213 | BC: 24,178 (Moderate) | Range Trading |
| On-Balance Volume (OBV) | Downward Slope | Distribution Pattern | Institutional Exit |
A. Bollinger Bands (20, 2) & Volatility Bandwidth Analysis
BOLLINGER BANDS (20, 2) DAILY STRUCTURAL POSTURE
24,785 ------------------------------------------------------------- Upper Band (+2σ)
\
24,420 ----------------- 20 SMA Midline (Baseline Resistance)
\
24,198 ===================== [ CURRENT SPOT: 24,198.60 ]
\
24,055 ------------------------------------------------------------- Lower Band (-2σ)
- Band Position (%B): With the Nifty closing at 24,198.60 against a 20-day Simple Moving Average (SMA) of 24,420 and a Lower Band of 24,055, the %B indicator sits at 0.198. A %B value under 0.20 signifies that the asset is trading in the extreme bottom quintile of its statistical 20-day distribution.
Bandwidth Dynamics: The Bollinger Bandwidth (BBW), defined as:
Bandwidth=Upper Band−Lower BandMiddle Band×100=24,785−24,05524,420×100≈2.99%Bandwidth=Middle BandUpper Band−Lower Band×100=24,42024,785−24,055×100≈2.99%
The bands have begun expanding after a multi-week contraction, signaling that the ongoing downward drift represents a directional volatility expansion rather than random noise.
- Interaction with the Lower Band: When candles ride the Lower Bollinger Band without penetrating below it on a daily closing basis, it typically signals a "Band Walk" in strong downtrends, or an imminent mean-reversion snapback toward the 20 SMA if an exhaustion hammer forms.
B. Volume Spread Analysis (VSA) & Volume Profile Metrics
VOLUME PROFILE COMPOSITION (AUG 2026 RANGE)
24,500 ────────────────────────────────────── [ VAH: Value Area High ]
24,420 ▓▓▓▓▓▓▓▓▓▓▓▓▓▓▓▓▓▓▓▓▓▓▓▓▓▓▓▓▓▓▓▓▓▓▓▓▓▓ [ High Volume Node ]
24,310 ▓▓▓▓▓▓▓▓▓▓▓▓▓▓▓▓▓▓▓▓▓▓▓▓▓▓▓▓▓▓▓▓▓▓▓▓▓▓▓▓▓▓▓▓▓▓▓▓▓▓▓▓ [ POC: Point of Control ]
24,180 ▓▓▓▓▓▓▓▓▓▓▓▓▓▓▓▓▓▓▓▓▓▓ [ Current Volume Concentration ]
24,050 ────────────────────────────────────── [ VAL: Value Area Low ]
- Point of Control (POC): The highest concentration of traded volume over the last 15 sessions sits at 24,310. Because price is currently trading below the POC, the market is structurally positioned in an Acceptance of Lower Value state.
- Value Area Boundaries:
- Value Area High (VAH): 24,500
- Value Area Low (VAL): 24,050
- The index is currently probing the lower extremity of its Value Area (24,050–24,180). In Market Profile theory, if price enters the bottom of the Value Area and fails to break out into single-print discovery, it historically rotates back toward the POC (24,310).
- Volume Spread Behavior: Today's volume was 12% lower than the 20-day average trading volume. Low-volume declines following multiple down days frequently indicate "Supply Exhaustion"—sellers are becoming reluctant to liquidate at these depressed prices without new negative fundamental catalysts.
C. Relative Strength Index (RSI 14) Momentum Regime
RSI (14) MOMENTUM SHIFT (DAILY)
70 ──────────────────────────────────────────────────────── Overbought Boundary
60 ──────────────────────── Bull Market Support Line
50 ──────────────────────── Neutral / Equilibrium Mark
41.20 ===================== [ CURRENT RSI LEVEL: 41.20 ]
30 ──────────────────────────────────────────────────────── Oversold Boundary
- Andrew Cardwell Range Shift Rules: In established bull markets, the daily RSI tends to oscillate between 40 and 80, with the 40 level acting as dynamic support during corrections. In bear markets, RSI oscillates between 20 and 60.
- Current Posture: At 41.20, the daily RSI is testing the critical bull-market support floor. A decisive daily close below 40 would technically confirm a regime transition into a deeper corrective cycle.
- Hourly Bullish Divergence: On the 60-minute chart, Nifty made a lower price low today (24,174.50 vs yesterday's 24,248.80), but the 60-minute RSI printed a higher low (37.85 vs 34.10). This subtle Class-A Bullish Divergence hints that downward momentum is decelerating internally.
D. Exponential Moving Average (EMA) Ribbon Alignment
PRICE RELATIONSHIP TO KEY EXPONENTIAL MOVING AVERAGES
24,435.10 ────────────────────────────────────────────────── 20-Day EMA (Short-Term Ceiling)
24,240.50 ────────────────────────────────────────────────── 50-Day EMA (Immediate Inflection)
24,198.60 ==================== [ SPOT: 24,198.60 ]
23,980.20 ────────────────────────────────────────────────── 100-Day EMA (Crucial Baseline)
23,310.00 ────────────────────────────────────────────────── 200-Day EMA (Macro Structural Base)
- The 50 EMA Test: Today, the Nifty closed marginally below its 50-day EMA (24,240.50). In technical history, closes below the 50 EMA that are quickly reclaimed within 48 hours are classified as "Bear Traps," whereas failure to reclaim the 50 EMA opens a direct path to test the 100-day EMA near 23,980.
- The 200 EMA Distance: The long-term structural bull trend remains intact, as the index is trading more than 880 points above its rising 200-day EMA (23,310).
E. MACD (12, 26, 9) Zero-Line Posture
- MACD Line: Sits at -62.40 below the Signal Line (-38.00).
- Histogram: Reads -24.40. The negative histogram bars have ceased expanding exponentially and have started flattening over the last two sessions, reflecting a deceleration in downside momentum.
F. Central Pivot Range (CPR) & Classical Pivot Points
The Central Pivot Range provides a mathematical framework for day trading:
Pivot (P)=High+Low+Close3=24,266.85+24,174.50+24,198.603≈24,213.30Pivot (P)=3High+Low+Close=324,266.85+24,174.50+24,198.60≈24,213.30
Bottom Central (BC)=High+Low2=24,266.85+24,174.502≈24,220.65Bottom Central (BC)=2High+Low=224,266.85+24,174.50≈24,220.65
Top Central (TC)=(Pivot−BC)+Pivot≈24,205.95Top Central (TC)=(Pivot−BC)+Pivot≈24,205.95
| PIVOT LEVEL | PRICE (POINTS) | TECHNICAL SIGNIFICANCE |
| Resistance 3 (R3) | 24,435.60 | Extreme Bullish Expansion Target |
| Resistance 2 (R2) | 24,350.25 | Major Supply Zone & Previous Breakdown Node |
| Resistance 1 (R1) | 24,275.50 | Immediate Resistance & CPR Boundary |
| Central Pivot (P) | 24,213.30 | Daily Equilibrium / Fair Value |
| Support 1 (S1) | 24,140.40 | Immediate Demand & Intraday Buffer |
| Support 2 (S2) | 24,082.20 | Key Structural Fib / Value Area Low |
| Support 3 (S3) | 23,995.00 | Psychological Support & 100-Day EMA Confl. |
A. Put-Call Ratio (PCR) Analysis
- Current Total PCR (OI): 0.74
- Interpretation: A Put-Call Ratio below 0.80 indicates that call option writers (bears) outnumber put option writers. Historically, when Nifty PCR drops into the 0.65 – 0.75 zone, the market enters a statistically oversold regime, where the risk-reward ratio for continued aggressive short selling diminishes rapidly, creating prime conditions for sudden short-covering spikes.
B. Strike-Wise Open Interest Concentration
- The 24,500 & 24,300 Call Walls (Immediate Ceilings): Heavy Call Open Interest additions of over 9.1 Million shares at 24,300 CE and 11.2 Million shares at 24,500 CE confirm that option sellers view 24,300–24,350 as a formidable resistance barrier for the current expiry.
- The 24,200 & 24,000 Put Floors (Immediate Cushions): The 24,200 Put strike holds 8.9 Million shares, while the 24,000 Put strike holds the largest concentration of the entire series with 12.4 Million shares, establishing 24,000 as the definitive structural bedrock for the index.
C. Max Pain Strike
- Current Max Pain Point: 24,300
- Theory: The Max Pain theory suggests that market makers will attempt to steer the spot price toward the strike where the maximum number of options expire worthless (24,300), exerting an upward gravitational pull from current spot levels (24,198.60).
6. Sectoral Performance & Market Breadth Dynamics
Sectoral divergence highlights where capital is rotating within the domestic landscape:
+---------------------------------------------------------------------------------------------------+
| SECTOR INDEX | TODAY'S CHANGE (%) | TECHNICAL BIAS | LEAD DRIVERS |
+----------------------------+------------------------+------------------------+--------------------+
| Nifty IT | -1.58% 🔴 | Severe Weakness | INFY, HCLTECH, TCS |
| Nifty Financial Services | -0.48% 🔴 | Mild Weakness | HDFCBANK, ICICIBANK|
| Nifty Auto | -0.32% 🔴 | Neutral Consolidation | MARUTI, TATAMOTORS |
| Nifty FMCG | -0.22% 🔴 | Defensive Absorption | ITC, HINDUNILVR |
| Nifty Pharma | +0.15% 🟢 | Defensive Strength | SUNPHARMA, CIPLA |
| Nifty Metal | +0.42% 🟢 | Relative Outperformer | TATASTEEL, JSWSTEEL|
| Nifty Realty | -0.65% 🔴 | Corrective Phase | DLF, GODREJPROP |
+---------------------------------------------------------------------------------------------------+
- Technology (IT) Drag: The IT index remains the primary anchor pulling the Nifty down, registering its fifth consecutive daily drop.
- Metals & Healthcare Insulation: Export-oriented metals and domestic pharmaceuticals displayed relative strength, preventing a broader market collapse.
7. Definitive Support and Resistance Mapping Grid
Based on the confluence of Volume Profile, Fibonacci extensions, moving averages, and classical pivots, here are the exact structural price levels for the upcoming session:
+---------------------------------------------------------------------------------------------------+
| LEVEL CLASSIFICATION | EXACT PRICE ZONE | CONFLUENCE FACTORS |
+----------------------------+------------------------+---------------------------------------------+
| Major Resistance 3 (R3) | 24,500 – 24,520 | Major Call OI Wall + Daily 20 SMA + VAH |
| Intermediate Resistance 2 | 24,360 – 24,380 | Monday Swing High + Hourly Bearish OB + R2 |
| Immediate Resistance 1 | 24,275 – 24,310 | Day's High + Daily CPR TC + Point of Control|
| ────────────────────────── | ────────────────────── | ─────────────────────────────────────────── |
| CURRENT SPOT PRICE | 24,198.60 | Trading at 50-Day EMA Confluence |
| ────────────────────────── | ────────────────────── | ─────────────────────────────────────────── |
| Immediate Support 1 (S1) | 24,140 – 24,175 | Today's Low + Trendline Support + Pivot S1 |
| Intermediate Support 2 (S2)| 24,050 – 24,080 | Lower Bollinger Band (-2σ) + Value Area Low |
| Major Structural Base (S3) | 23,980 – 24,000 | 100-Day EMA + Max Put Open Interest Wall |
+---------------------------------------------------------------------------------------------------+
8. Probabilistic Scenarios for Tomorrow's Session
Rather than guessing directional certainty, professional technical analysis maps out objective, condition-based probabilistic scenarios:
PROBABILISTIC SCENARIO DECISION TREE
│
[ MARKET OPEN: 09:15 AM ]
│
┌─────────────────────────────┼─────────────────────────────┐
▼ ▼ ▼
[ SCENARIO A: 45% ] [ SCENARIO B: 35% ] [ SCENARIO C: 20% ]
Bullish Relief Bounce Bearish Breakdown Range Compression
Reclaims 24,275 with Volume Breaks below 24,140 Chops inside 24,150–24,280
Target: 24,360 -> 24,450 Target: 24,080 -> 23,980 Theta Decay Dominance
Scenario A: Bullish Relief Bounce / Short-Covering Expansion (45% Probability)
- Pre-Conditions: Overnight stabilization in global equity futures, Brent crude holding below $91, and GIFT Nifty indicating a flat-to-positive open.
- Technical Trigger: Nifty opens above 24,213 (Central Pivot) and sustains above 24,275 on a 15-minute closing basis during the first hour of trade.
- Structural Targets:
- Primary Objective: 24,360 (Unfilled Hourly Fair Value Gap)
- Secondary Objective: 24,440 – 24,480 (20-Day SMA / Downward Trendline Resistance)
- Technical Invalidation: Any failure to stay above 24,200 nullifies the short-covering hypothesis.
🔴 Scenario B: Bearish Breakdown & Volatility Continuation (35% Probability)
- Pre-Conditions: Escalation in Middle East geopolitical tensions, Brent crude pushing toward $93, or fresh FII cash market selling exceeding ₹3,000 Crore.
- Technical Trigger: A sustained breakdown and 15-minute close below the immediate swing low of 24,140.
- Structural Targets:
- Primary Objective: 24,050 – 24,080 (Lower Bollinger Band & S2 Pivot)
- Secondary Objective: 23,980 – 24,000 (100-Day EMA & Major Put Open Interest Wall)
- Technical Invalidation: A quick reclaim back above 24,200 with heavy domestic buying volumes.
🟡 Scenario C: Range-Bound Consolidation & Premium Decay (20% Probability)
- Pre-Conditions: Muted global cues and an absence of directional triggers ahead of major central bank commentary.
- Technical Behavior: Price remains trapped between 24,150 (Support) and 24,280 (Resistance) throughout the session, oscillating around the Central Pivot (24,213).
- Market Dynamics: Characterized by rapid option premium erosion (Theta decay), compressed intraday volatility, and false breakouts on low volume.
9. Risk Architecture & Volatility Sizing Principles
Technical levels are only as effective as the risk management framework applied to them.
THE SYSTEMATIC RISK PYRAMID
▲
/ \
/ 1 \ <─── Max 1% - 1.5% Risk per Transaction
/-----\
/ 2 \ <─── Trailing SL to Breakeven at 1:1.5 RR
/---------\
/ 3 \ <─── Volatility-Adjusted Lot Sizing (ATR)
/-------------\
- Average True Range (ATR) Sizing: The 14-day ATR for Nifty 50 currently sits at 168 points. Technical invalidation stops should be placed beyond structural swing points with an ATR buffer of at least 15–20 points to avoid algorithmic stop hunts.
- The 09:15–09:30 Trap Filter: Market participants should avoid executing directional assumptions in the first 15 minutes of trade, as early morning volatility is heavily dominated by algorithmic liquidity rebalancing and overnight gap pricing.
- India VIX Sensitivity: With India VIX hovering near 11.78, options premiums remain relatively inexpensive, meaning sudden intraday spikes in volatility can lead to sharp gamma moves on 0-DTE and weekly expiry contracts.
10. Frequently Asked Questions (FAQs)
1. What is the overall technical trend of Nifty 50 after today's close?
While the long-term structural trend remains bullish above the 100-day and 200-day EMAs (23,980 and 23,310), the short-term trend is classified as corrective/bearish due to a series of lower highs and trading below the 20-day SMA (24,420).
2. What does the current Put-Call Ratio (PCR) of 0.74 indicate?
A PCR of 0.74 indicates that the derivatives market is heavily positioned with Call option writes (bearish sentiment). Historically, a PCR in the 0.65–0.75 zone places the index in an oversold condition, where the likelihood of a sharp short-covering bounce increases.
3. What are the key support and resistance levels to watch tomorrow?
- Immediate Support: 24,140 – 24,175
- Major Support: 23,980 – 24,050
- Immediate Resistance: 24,275 – 24,310
- Major Resistance: 24,360 – 24,500
4. Why is the 24,000 level considered crucial for Nifty?
The 24,000 level represents a confluence of major psychological support, the rising 100-day Exponential Moving Average (23,980), and the single largest Put Open Interest concentration (12.4 Million contracts) in the derivatives market.
Financial & Regulatory Disclaimer
InvesTalks provides stock market analysis, equity research, and financial content strictly for educational and informational purposes only. We are not a SEBI-registered investment advisor or portfolio manager. Market investments are subject to market risks. Always perform your own research or consult a certified SEBI-registered financial advisor before making buy/sell decisions.
Milky Mist Dairy Food Ltd: The Complete Analysis Before and...
NEXTNifty 50 technical analysis August 19 2026
Admin
Equity Research & Financial AnalysisCurated by the InvesTalks financial analysis team. Dedicated to providing disciplined stock market insights, technical chart evaluations, and long-term investor education.
 Market News & Outlook
Login to comment.