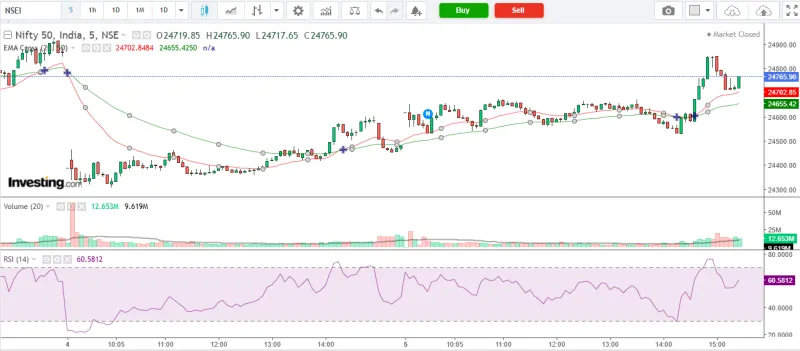
The Nifty 50 index experienced a volatile trading session on March 05, 2026, with the market attempting an intraday recovery after early weakness.
Despite fluctuations throughout the day, the index managed to close near the middle-to-upper portion of the intraday range. The session reflected mixed sentiment where intraday buying attempts appeared, but the broader structure remained under pressure from higher time-frame resistance levels.
Today’s Market Snapshot
Open: 24,615.95
High: 24,851.50
Low: 24,522.90
Close: 24,765.90
Intraday Range: 328.60 points
Volume: 504.339M
Average Volume: 395.155M
Volume Change: ~27.6% higher than average
The market traded within a wide range, suggesting increased volatility and strong participation. The index ultimately recovered from intraday lows and closed significantly above them, indicating late-session buying interest.
Price Action Summary
The Nifty opened weak at 24,615 and initially attempted to stabilize before pushing upward toward the session high near 24,851. This move represented a short-term recovery from early selling pressure. However, the index faced resistance near the upper range and could not sustain the upward momentum for a breakout.
During the session, the market tested the lower support region near 24,522 where buyers stepped in aggressively. The strong rejection from the day’s low suggested demand emerging at lower levels. This behavior formed a candle resembling a long lower-shadow recovery candle, often interpreted as a sign that sellers temporarily lost control.
Despite this recovery, the index still remained well below key higher-timeframe moving averages, indicating that the broader trend pressure remains to the downside.
Strong bounce from intraday support zone
High volatility session
Failure to reclaim major moving averages
Volume Commentary
Trading activity increased significantly during the session. The total traded volume reached 504.339M, compared to the average of 395.155M, representing an increase of approximately 27.6%.
Higher-than-average volume during a volatile session suggests that institutional participants were active. The strong bounce from the day’s low combined with heavy volume may indicate short-term accumulation or short-covering activity. However, until the index breaks above key resistance levels, the volume spike could also reflect distribution near resistance zones.
Technical Indicators
20 EMA: 25,540.26 The index closed well below the 20-day EMA, which suggests that short-term trend momentum remains weak.
50 EMA: 25,342.14 Price also stayed below the 50-day EMA, reinforcing that the broader market structure is currently under pressure.
Relative Strength Index (RSI 14): 37.00 RSI remained in the lower neutral zone, approaching oversold territory (below 30). This indicates weak momentum but potential for short-term relief rallies.
Momentum Context: With RSI below 40 and price trading under major moving averages, the market structure currently shows bearish momentum on higher timeframes, even though intraday rebounds are appearing.
What Might Happen Tomorrow
If buyers manage to hold the support region above 24,520 and push the index back above 24,850, the market could attempt a short-term relief rally. Such a move might encourage further recovery toward the next resistance zones.
However, if the index fails to sustain above the recovery zone and breaks below 24,520, selling pressure could resume. In that scenario, the market might move toward deeper support levels as bearish momentum continues.
Given the elevated volume and volatile price structure, the next session may play an important role in determining whether today's rebound was temporary stabilization or the beginning of a broader recovery attempt.
**Disclaimer: We are not SEBI registered. The content provided is for educational and informational purposes only and should not be considered investment advice. Stock market investments are subject to market risks. Please consult a SEBI-registered financial advisor before making investment decisions.**
InvesTalks is a powerful market learning and analysis platform built for traders, investors, and finance enthusiasts. Stay updated with real-time market insights, expert blogs, educational content, and smart investing strategies — all in one place.
ITS InvesTalks uses cookies to enhance your experience,
analyze traffic, and display relevant advertisements.
You can accept all cookies or manage your preferences.


Login to comment.