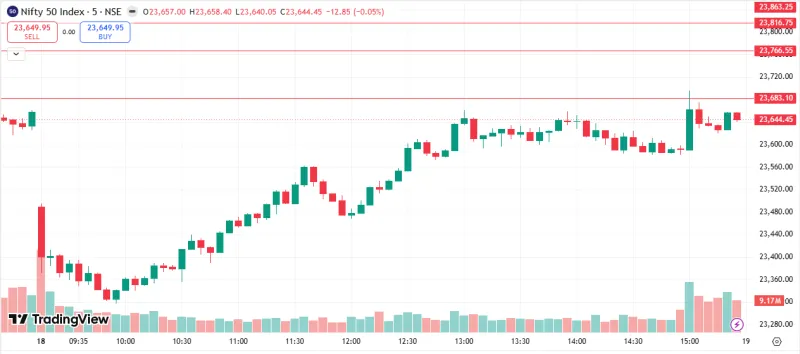
The Nifty 50 began the first trading week of March with a session characterized by controlled consolidation and elevated participation. While the index did not stage an aggressive breakout, it continued to trade above key short-term moving averages, suggesting that buyers maintained structural control despite limited intraday expansion.
Today’s Market Snapshot
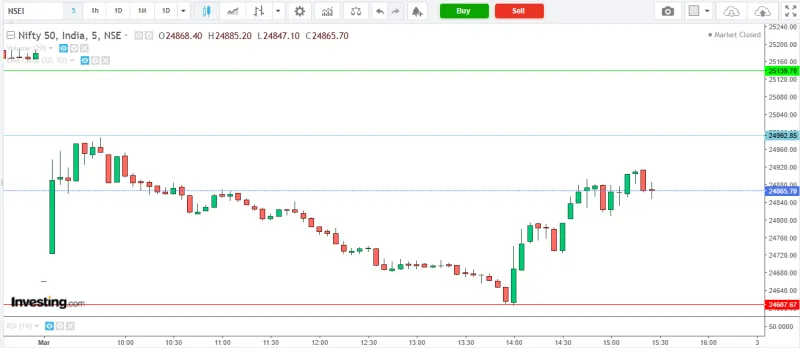
Open: 24,868
High: 24,886
Low: 24,845
Close: 24,865
Intraday Range: 41 points
Volume: 13.414 Million
Average Volume: 9.66 Million
Volume vs Average: ~38.8% above average participation
The session ended marginally below the open, forming a compact range candle. Despite the small net movement, activity levels were significantly elevated, pointing toward active positioning beneath the surface.
Price Action Breakdown
Nifty opened near the upper end of the day’s range at 24,868 and briefly extended toward 24,886 before encountering supply pressure. The early attempt to push higher lacked strong follow-through, indicating temporary resistance near intraday highs.
Selling pressure remained limited, however. The index found support at 24,845, where buyers stepped in to stabilize price action. The recovery toward the close suggested demand absorption at lower levels.
The resulting candlestick was a small-bodied candle, reflecting indecision rather than directional dominance. The narrow range combined with high volume often indicates:
Compression before expansion
Possible accumulation phase
Short-term pause within an ongoing trend
Importantly, the index did not violate key short-term support levels during the session, which keeps the broader short-term structure intact.
Volume Analysis
Volume expanded sharply to 13.414M compared to the 9.66M average — an increase of nearly 39%. Elevated volume during a tight-range session typically carries important implications.
There are two primary interpretations:
Constructive View: High volume with limited downside suggests institutional accumulation and absorption of supply.
Neutral View: Market participants may be building positions ahead of a breakout trigger.
Cautionary Note: If future sessions fail to expand upward, today’s heavy volume could reflect distribution near resistance.
At present, the volume structure leans slightly constructive because price held above short-term moving averages.
Technical Indicator Overview
20 EMA: 24,823 Price closed above the 20-day EMA, maintaining short-term bullish alignment. The rising slope of this average acts as dynamic support.
50 EMA: 24,814 The index also remained above the 50-day EMA, reinforcing medium-term structural strength. A sustained hold above both moving averages supports trend continuation.
Relative Strength Index (RSI): 59.2 RSI stayed in the neutral-to-positive zone. It is below the overbought threshold (70), which indicates upside room remains without momentum exhaustion.
The alignment of price above both 20 and 50 EMAs, combined with RSI near 60, typically signals stable upward momentum rather than overheated conditions.
Key Levels to Watch
Immediate Resistance: 24,886 (Today’s High)
Immediate Support: 24,845 (Today’s Low)
Dynamic Support: 20 EMA (24,823)
Secondary Support: 50 EMA (24,814)
What Might Happen Tomorrow?
If bulls successfully defend the 24,845–24,823 support zone and push above 24,886 with continued strong participation, the index could attempt a short-term breakout expansion. Sustained trading above today’s high may trigger momentum-driven continuation.
On the other hand, if price slips below 24,845 and loses the 20 EMA, short-term sentiment could weaken. A deeper pullback toward the 50 EMA (24,814) might then unfold. A decisive break below that region could shift momentum into a broader consolidation phase.
Given the elevated volume and compressed range, tomorrow’s session may reveal whether today represented pre-breakout accumulation or hidden supply near resistance.
**Disclaimer: We are not SEBI registered. The content provided is for educational and informational purposes only and should not be considered investment advice. Stock market investments are subject to market risks. Please consult a SEBI-registered financial advisor before making investment decisions.**
InvesTalks is a powerful market learning and analysis platform built for traders, investors, and finance enthusiasts. Stay updated with real-time market insights, expert blogs, educational content, and smart investing strategies — all in one place.
ITS InvesTalks uses cookies to enhance your experience,
analyze traffic, and display relevant advertisements.
You can accept all cookies or manage your preferences.


Login to comment.