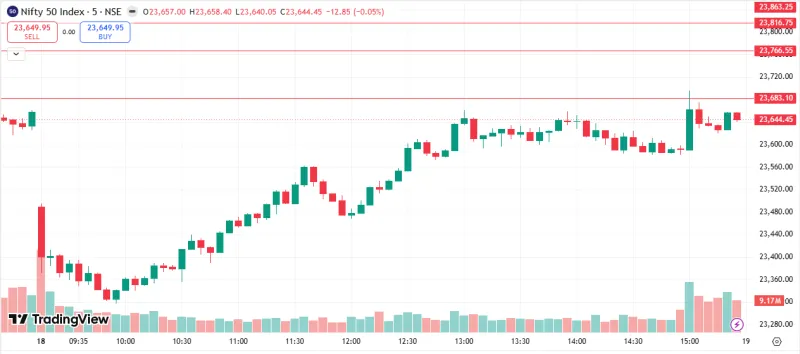
The Nifty 50 index experienced a volatile trading session on March 06, 2026, with the market attempting an intraday recovery after early weakness.
Today’s Market Snapshot
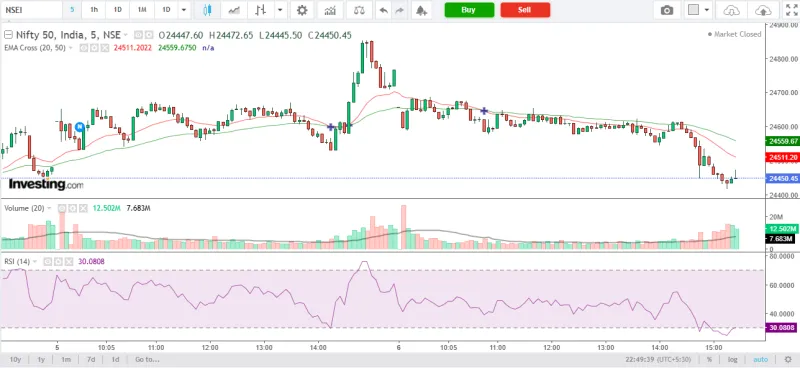
Open: 24,447.60
High: 24,472.65
Low: 24,445.50
Close: 24,450.45
Volume: 12.502M
Average Volume (20): 7.683M
Trading volume was approximately 62% higher than the 20-period average, indicating elevated market participation during the session.
Price Action Summary
The Nifty 50 index traded within a relatively narrow intraday range but continued to show signs of broader market weakness visible on the daily chart. Price opened near 24,447 and attempted a mild recovery during early trading hours, briefly reaching an intraday high of 24,472 before losing momentum.
The session displayed persistent selling pressure with price staying below key moving averages.
Intraday candles suggested a short consolidation phase following the sharp decline seen in the previous sessions.
The market formed a small-bodied candle near the session low, which reflected indecision between buyers and sellers.
Despite minor intraday rebounds, price remained structurally weak below short-term trend averages.
The broader daily trend still indicated downward momentum after the recent breakdown from higher levels.
Volume Commentary
Volume during the session expanded significantly relative to the recent average.
The higher trading activity while prices remained weak suggests continued distribution or active selling interest in the market.
However, the absence of further sharp downside movement despite high volume may also indicate short-term stabilization or absorption of selling pressure at lower levels.
Technical Indicators
20 EMA: 24,511.20 Price closed below the 20-day EMA, indicating short-term bearish momentum.
50 EMA: 24,559.68 The index also remained below the 50-day EMA, reinforcing a weak intermediate trend.
Relative Strength Index (RSI 14): 30.08 RSI moved very close to the oversold threshold (below 30), suggesting the market may be approaching a zone where short-term relief moves could occur.
Bollinger Bands (Interpretation): Based on the sharp decline visible on the daily chart, price appears to be trading near the lower volatility band, which often accompanies strong downward momentum.
What Might Happen - 09 March 2026
The next trading session may depend heavily on how the market reacts around the current support zone.
If buyers manage to defend the area around 24,400–24,450, the index could attempt a short-term rebound toward the 20 EMA region near 24,500.
If the index fails to hold the current levels and selling pressure continues, the market might extend the downward move toward the next potential support zones around 24,250–24,200.
Given the RSI near oversold territory, the market could also enter a consolidation phase before establishing the next directional move.
**Disclaimer: We are not SEBI registered. The content provided is for educational and informational purposes only and should not be considered investment advice. Stock market investments are subject to market risks. Please consult a SEBI-registered financial advisor before making investment decisions.**
InvesTalks is a powerful market learning and analysis platform built for traders, investors, and finance enthusiasts. Stay updated with real-time market insights, expert blogs, educational content, and smart investing strategies — all in one place.
ITS InvesTalks uses cookies to enhance your experience,
analyze traffic, and display relevant advertisements.
You can accept all cookies or manage your preferences.


Login to comment.