Bharat Electronics Limited (BEL) is a Government of India Navratna PSU under the Ministry of Defence, established in 1954 and headquartered in Bengaluru, Karnataka. BEL is India's premier defence electronics company, engaged in the design, development, manufacture, and supply of advanced electronic systems and equipment for the Indian Armed Forces (Army, Navy, and Air Force), as well as for select civilian markets.
The company has a presence in 29 Strategic Business Units (SBUs) that cover Radar & Fire Control Systems, Electronic Warfare Systems, Communication & Network Centric Systems (C4I), Weapon Systems, Naval Systems, Electro Optics, Avionics, Homeland Security, etc. Four new SBU additions: Network & Cyber Security, Unmanned Systems (Drones/UAVs), Seekers, and Arms & Ammunition, demonstrate the company's aggressive expansion drive towards new-generation defence technologies.
BEL is also expanding its presence in the civilian sector, including Smart Cities, e-Governance, Solar Energy, Healthcare Electronics, Cyber Security, etc., thereby improving its revenue base. The company is listed on the NSE (BEL) and BSE (500049) exchanges and is a constituent of the Nifty 50, BSE Sensex, and Nifty India Defence Indices.
Recent Developments
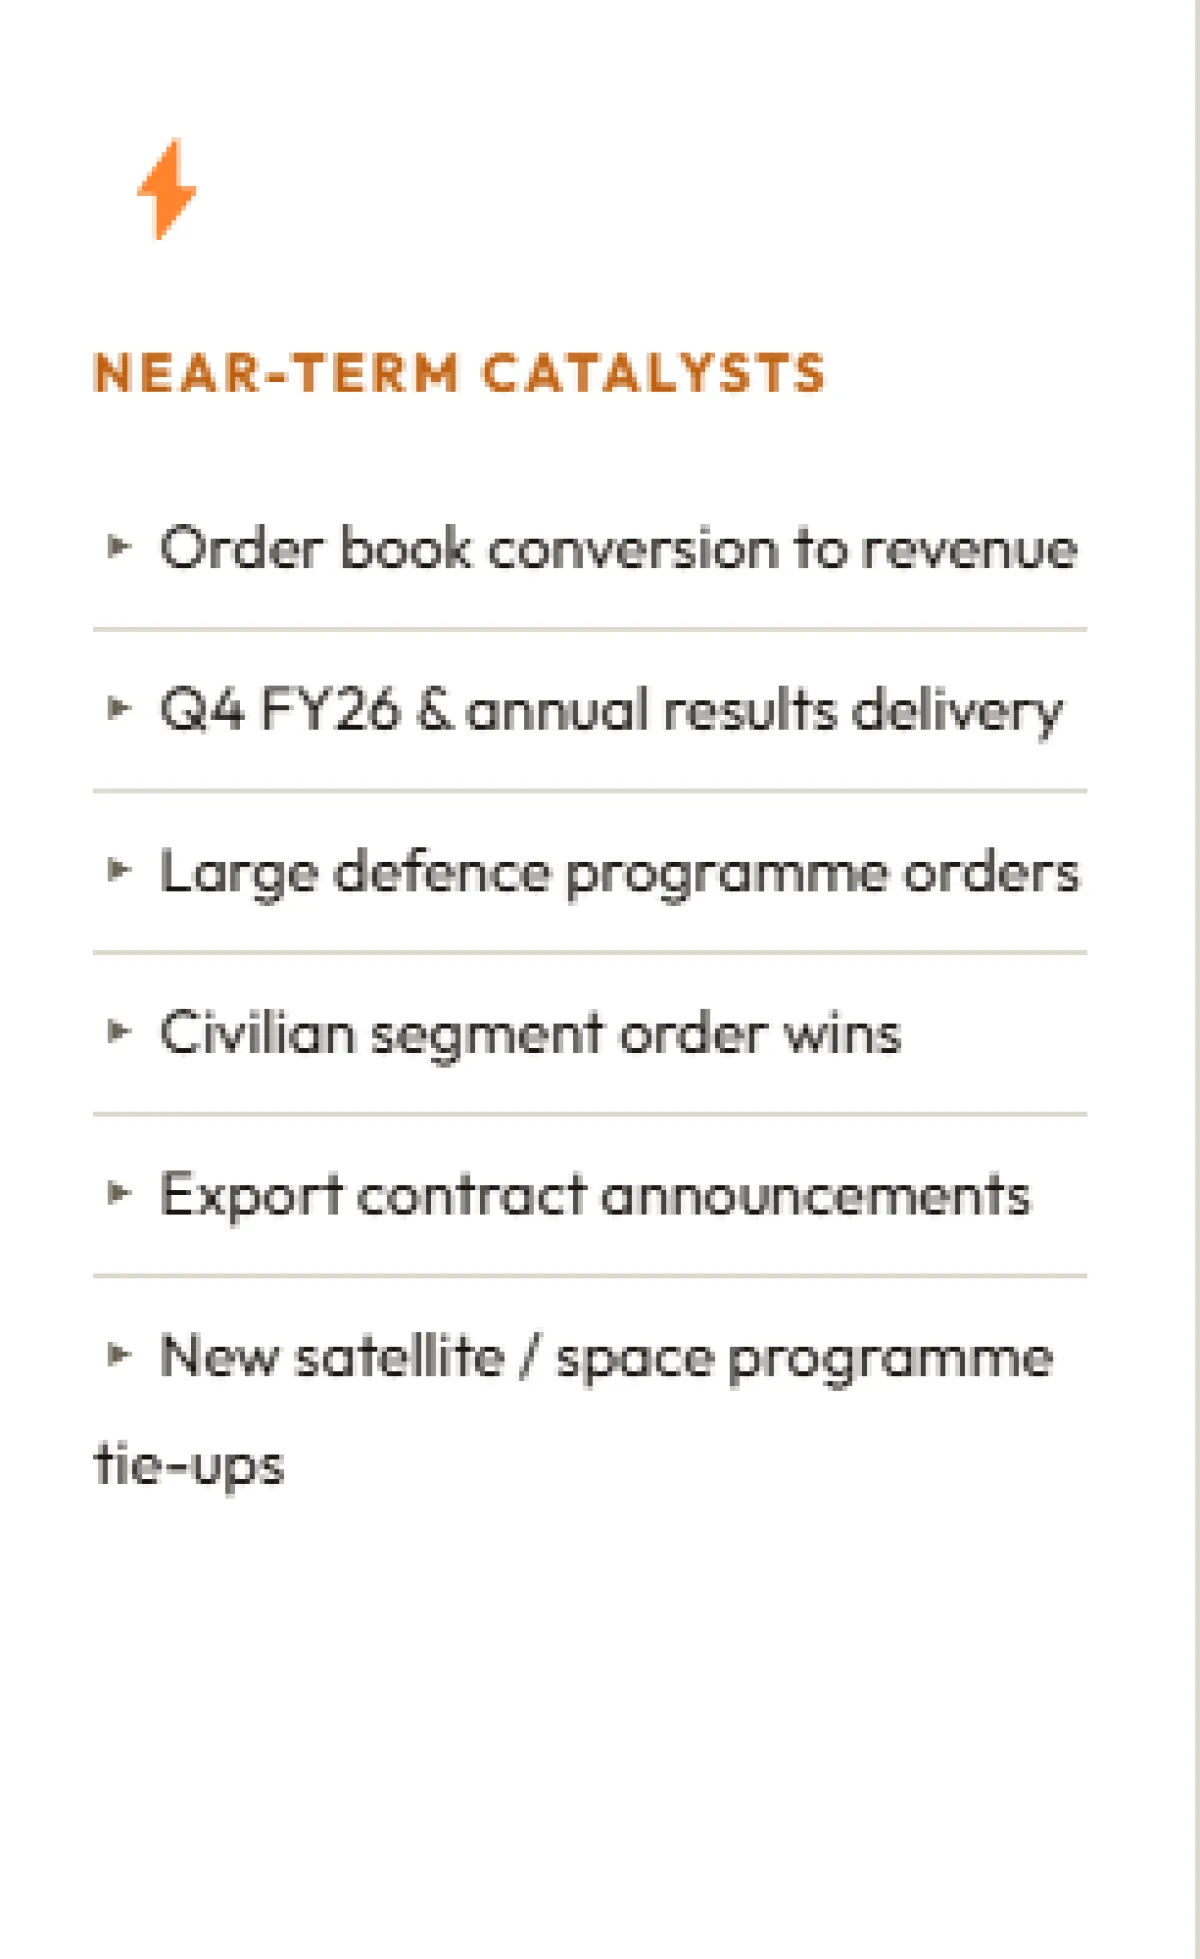
An interim dividend of ₹1.95 per share was announced by BEL for FY2025-26. (Board meeting held on February 27, 2026.) Total Order book as of Q2 FY26 was at ₹74,859 cr, with ~71% expected to convert into revenue in FY26-FY27. BEL signed an MoU with Bellatrix Aerospace for VLEO satellite systems. Export orders are being added from ASEAN, Africa, and Latin America.
Investment Recommendation
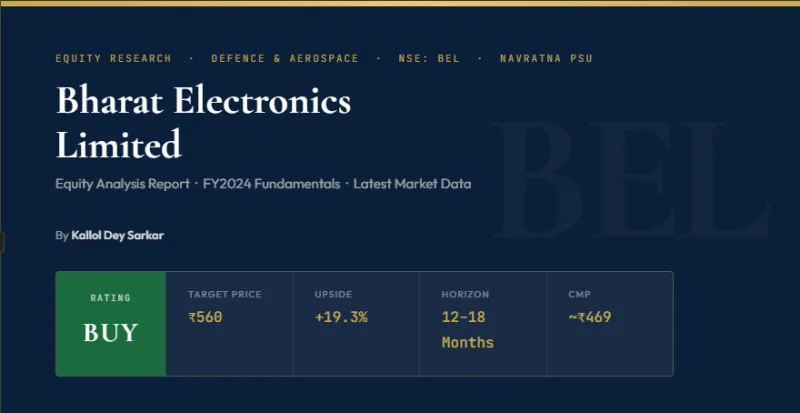
Recommendation
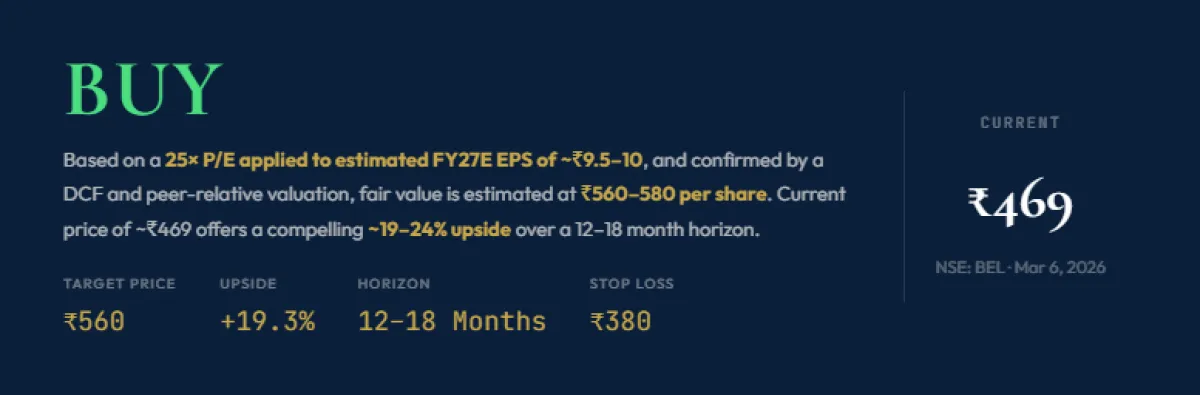
BUY
Target Price
₹560 (+19.3% upside)
Current Market Price
~₹469 (Mar 6, 2026)
Investment Horizon
12–18 months
Market Cap
~₹3,42,427 Cr
Key Strengths at a Glance
Near-monopoly in India's defence electronics supply chain
Virtually debt-free balance sheet
ROE of 24.2% (FY24), rising to 26.5% (FY25)
Revenue 5-year CAGR of 12.3% (FY20–FY24)
Strong order book visibility (~₹74,859 Cr)
Beneficiary of India's Atmanirbhar Bharat / defence indigenization push
Quantitative Analysis
Market Valuation and Price Metrics:
Metric
Current Value
5-Year Trend
Assessment
Market Capitalisation
₹3,42,427 Cr
Strongly increasing
Expanding
Current Stock Price
~₹469
Multi-year uptrend
Bullish
P/E Ratio (TTM)
~56×
Premium; elevated vs history
Premium Priced
Trend Analysis: The market capitalization of BEL has grown significantly over the past five years, driven by the re-rating of the defence sector in India. The stock has generated +71.6% returns over the past year, which is significantly higher than the returns generated by the Nifty 50 index. The P/E ratio of the stock is around 56×, which reflects the significant re-rating driven by robust defence budgetary allocations.
Key Takeaway: BEL's stock has a premium valuation, which is justified by the company's strategic position and earnings growth acceleration. From the perspective of a long-term investor, the robust order book and positive policy trends warrant the premium valuation. There is volatility risk in the short term, depending on the growth outlook.
Profitability and Returns:
METRIC
FY24
FY23
FY22
FY21
FY20
TREND
ROE
24.2%
21.2%
18.5%
16.0%
14.2%
Consistently Improving ↑
ROCE
32.3%
28.4%
24.0%
20.5%
18.0%
Strongly Improving ↑
Net Profit Margin
19.5%
16.6%
15.0%
14.5%
12.8%
Expanding ↑
Operating Profit Margin
24.0%
22.5%
20.2%
19.5%
18.0%
Improving ↑
Trend Analysis: BEL’s profitability ratios show a consistent five-year improving trend for all parameters. Its ROE, which was at 14.2% in FY20, has now increased to 24.2% in FY24 and further to 26.5% in FY25. Its ROCE, which was at 18%, has now increased to 32.3%, showing exceptional capital efficiency.
Key Takeaway: BEL has emerged as one of the best capital allocators in the Indian PSU universe with ROE at 24.2% (FY24) and ROCE at 32.3%. The increase in net profit margins to 19.5% (FY24) and 22.2% (FY25) reflects the company’s improving margins, which are the outcome of a higher product mix and operating leverage.
Growth Metrics:
Metric
5-Year CAGR (FY20–FY24)
5-Year CAGR (FY21–FY25)
Trend
Revenue Growth Rate
12.3%
14.7%
Accelerating ↑
Net Profit CAGR
21.8%
26.4%
Accelerating ↑
EPS Growth Rate
~21%
~26%
Accelerating ↑
Trend Analysis: The revenue growth rate has increased over the period, rising from 12.3% at a compounded rate between FY20 and FY24 to 14.7% at a compounded rate between FY21 and FY25, indicating the order execution trend from a robust order backlog. Net profits have grown at a higher rate, i.e., 26.4% at a compounded rate.
Key Takeaway: Profit increasing at a higher rate than revenue indicates that margins are improving structurally, which is a good sign of quality growth. EPS growth from ~₹2.88 in FY21 to ₹7.28 in FY25, with a CAGR of ~26%, proves the compounding equity story.
Balance Sheet Strength:
Metric
FY24
FY23
FY22
FY21
FY20
Trend
Debt-to-Equity Ratio
~0.02
~0.03
~0.04
~0.05
~0.06
Virtually Debt-Free ↑
Interest Coverage Ratio
437.7×
209.3×
—
—
—
Exceptional
Total Assets (₹ Bn)
390
350
—
—
—
Growing ↑
Trend Analysis: BEL has an almost debt-free balance sheet, a quality that is hard to find in large PSUs. The company’s D/E ratio is negligible (~0.02). Moreover, the interest coverage ratio of 437.7× in FY24 and surging to 567.6× in FY25 indicates zero risk in servicing debt.
Key Takeaway: BEL’s clean balance sheet is a huge competitive advantage, as it allows the company to self-fund its capital expenditures, ride out order delays, and seize strategic opportunities without any dilution or cost. This is a huge positive for investors.
Cash Flow Analysis:
Metric
FY25
FY24
FY23
FY22
Trend
Cash Flow from Operations (CFO, ₹ Bn)
~6
~47
~12
~10
Volatile but positive
Cash Flow from Investing (CFI, ₹ Bn)
+6
-59
—
—
Variable
CFO as % of Net Profit
~11%
~119%
~41%
—
Variable
Trend Analysis: The company's cash flow has been volatile, depending on the defence order payment cycles. FY24 has reported exceptional CFO of ₹47 Bn, up by 288.5% YoY, due to advance payments received for large system orders. FY25 has reported a lower CFO of ₹6 Bn, with working capital demand increasing (WCD up from 43.8 to 85.4 days).
Key Takeaway: CFO volatility is inherent in the business model, as defence procurement typically involves significant advance payments and milestone-based billing. The increase in working capital in FY25 is something to watch, but the order pipeline is healthy, implying medium-term cash flow remains robust.
Dividend Analysis:
Metric
FY25 (TTM)
FY24
FY23
FY22
FY21
Trend
Dividend Yield
0.56%
~0.50%
~0.60%
~0.70%
~0.80%
Declining yield (price-led)
Dividend Payout Ratio
~39%
~35%
~32%
~30%
~28%
Improving
DPS (Recent)
₹1.95/share
₹1.80
₹1.40
₹1.10
₹0.80
Growing DPS ↑
Trend Analysis: Absolute dividend per share has been increasing over the years, indicating an increase in profitability. The dividend yield has declined from ~0.80% to 0.56% due to a sharp increase in the stock price. The payout ratio has expanded to ~39%, which is among the stronger levels for a capex-light, high growth defence company.
Key Takeaway: The dividend policy of BEL is a balanced one, as the company rewards its shareholders while also maintaining sufficient funds for further research and development as well as capacity expansion. The high payout ratio of 39% also compares very favorably with the PSU counterparts. The major driver of returns is capital appreciation and not dividend yields.
Efficiency Ratios:
Metric
FY24
FY23
FY22
FY21
Trend
Asset Turnover Ratio (×)
~0.55
~0.52
~0.48
~0.42
Improving ↑
Working Capital Days
43.8 days
~35 days
~30 days
~28 days
Increasing (watch)
Return on Assets (ROA)
10.2%
8.5%
7.2%
6.1%
Improving ↑
Trend Analysis: Asset Turnover Ratios increasing from 0.42x to 0.55x indicate better utilization of the asset base as revenue grows. Working Capital Days are increasing, driven by longer execution cycles for complex system programs, which are manageable given BEL’s near-zero leverage.
Key Takeaway: The improvement in ROA from 6.1% to 10.2% is outstanding. The only efficiency ratio to watch is working capital elongation, with WCD increasing to 85.4 days in FY25, as BEL takes on more complex systems integration projects with longer delivery cycles.
Valuation Metrics — Comparison with Industry Peers:
Company
P/E (Approx.)
ROCE
D/E
Revenue CAGR (3Y)
Assessment
Bharat Electronics (BEL)
~56×
32.3%
~0.02
~17%
Premium, Justified
HAL (Hindustan Aeronautics)
~35×
~26%
~0.0
~20%
Cheaper, Strong
Data Patterns India
~60×
~28%
~0.0
~30%
High Growth Premium
MTAR Technologies
~50×
~18%
~0.1
~25%
Premium
Paras Defence
~70×
~15%
~0.1
~20%
Rich
Trend Analysis: Within the Defence Electronics & Aerospace space, BEL's current P/E of ~56x is high from an absolute perspective but justified given the scale, quality, and growth of the company. BEL's ROCE of 32.3% is superior to its peers within the large-cap PSU universe, significantly ahead of HAL, and even the broader PSU universe. The company's debt levels of near zero are a differentiating factor from the private sector peers in the Defence space.
Key Takeaway: BEL deserves its premium over commodity PSUs on the basis of its high ROCE, clean balance sheet, and structural growth story. Compared to smaller defence pure-plays that trade at much higher P/Es and lower ROCE, BEL offers the best risk-adjusted quality within Indian defence electornics stocks.
Qualitative Analysis
Business Model:
Core Products & Services: BEL's major activity is related to defence-grade electronic equipment such as radars, sonar equipment, electronic warfare equipment, communication networks, missile electronics, naval combat management systems, electro-optic equipment, and avionics. The company is the major supplier of electronic equipment to the Indian Armed Forces.
BEL also specializes in the design of electronic equipment for civilian sectors such as homeland security, e-governance, smart cities, solar energy equipment, healthcare electronics (ICU ventilators, X-ray equipment), and cybersecurity equipment.
Revenue Streams: While the defence segment accounts for 85 to 90 percent of the revenues, the balance comes from civilian businesses. Within the defence segment, BEL has been actively increasing its share of system integration, software-defined electronics, and maintenance contracts, which are typically more profitable. The export revenue, while currently small at around 500 to 600 Cr., is a key growth area.
Competitive Advantages: Near-monopoly status in several defence sub-systems, long-standing MoD relationship, DRDO co-development access, low-cost PSU structure, and Atmanirbhar Bharat regulatory protection.
Management Quality:
BEL has a management team of defence electronics professionals, and the CMD and functional directors are from within the company's own ranks of engineers and technical personnel. The majority promoter is the Government of India through the MoD, which lends stability and visibility to the defence procurement market.
BEL's corporate governance has significantly improved since listing, with a large number of independent directors on the company's board. Dividend payments, transparent annual reports, and MoU target achievement scores with the Ministry are all positives for a PSU.
Governance Positive: BEL has been consistently achieving higher than target MoU performance with the Ministry of Defence, and the company has a clean record with no major cases of fraud, accounting restatement, and governance issues.
Growth Strategy:
Expansion Plans:
New SBUs in Unmanned Systems (drones/UAVs) and Arms & Ammunition
Export push targeting ASEAN, Africa, and Latin America
Collaboration with Bellatrix Aerospace on satellite systems
Co-development agreements with foreign OEMs (technology transfer)
R&D Initiatives:
Central Research Laboratory (CRL) for advanced electronics
AI/ML integration in electronic warfare systems
Quantum Key Distribution for secure comms
Hyperspectral imaging and next-gen AESA radars
Drone-counter drone systems and UAV indigenisation
Shareholding Pattern Analysis
Category
Dec 2025
Sep 2025
Jun 2025
Mar 2025
Dec 2024
Trend
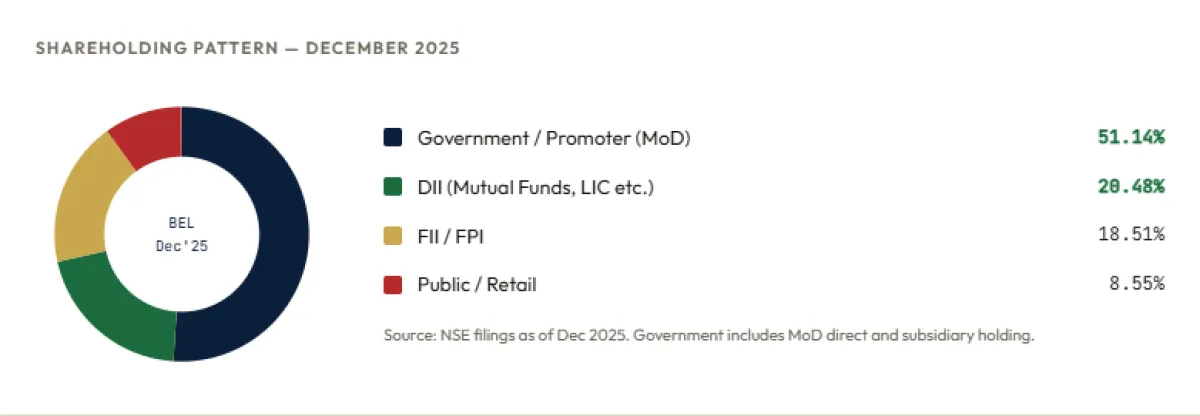
Promoters (GoI/MoD)
51.14%
51.14%
51.14%
51.14%
51.14%
Stable
DII (MF + LIC)
20.48%
~20%
~19%
~18%
~17.5%
Increasing ↑
FII / FPI
18.51%
~19%
~20%
~20.5%
~21%
Gradually decreasing
Public / Retail
8.55%
~8.7%
~9%
~9%
~9.5%
Slight decline
Mutual Funds (within DII)
14.82%
—
—
—
—
High MF Conviction
Analysis: The Government of India's promoter holding has remained rock-steady at 51.14%, signaling long-term strategic commitment. Domestic Institutional Investors (DIIs), especially mutual funds at 14.82%, have been increasing exposure — a strong vote of confidence from professional domestic fund managers. FII holdings have moderately declined from ~21% to ~18.5%, reflecting broader EM outflows rather than BEL-specific concerns. Mutual fund holding of 14.82% is particularly notable for a Nifty 50 component.
Investment Thesis
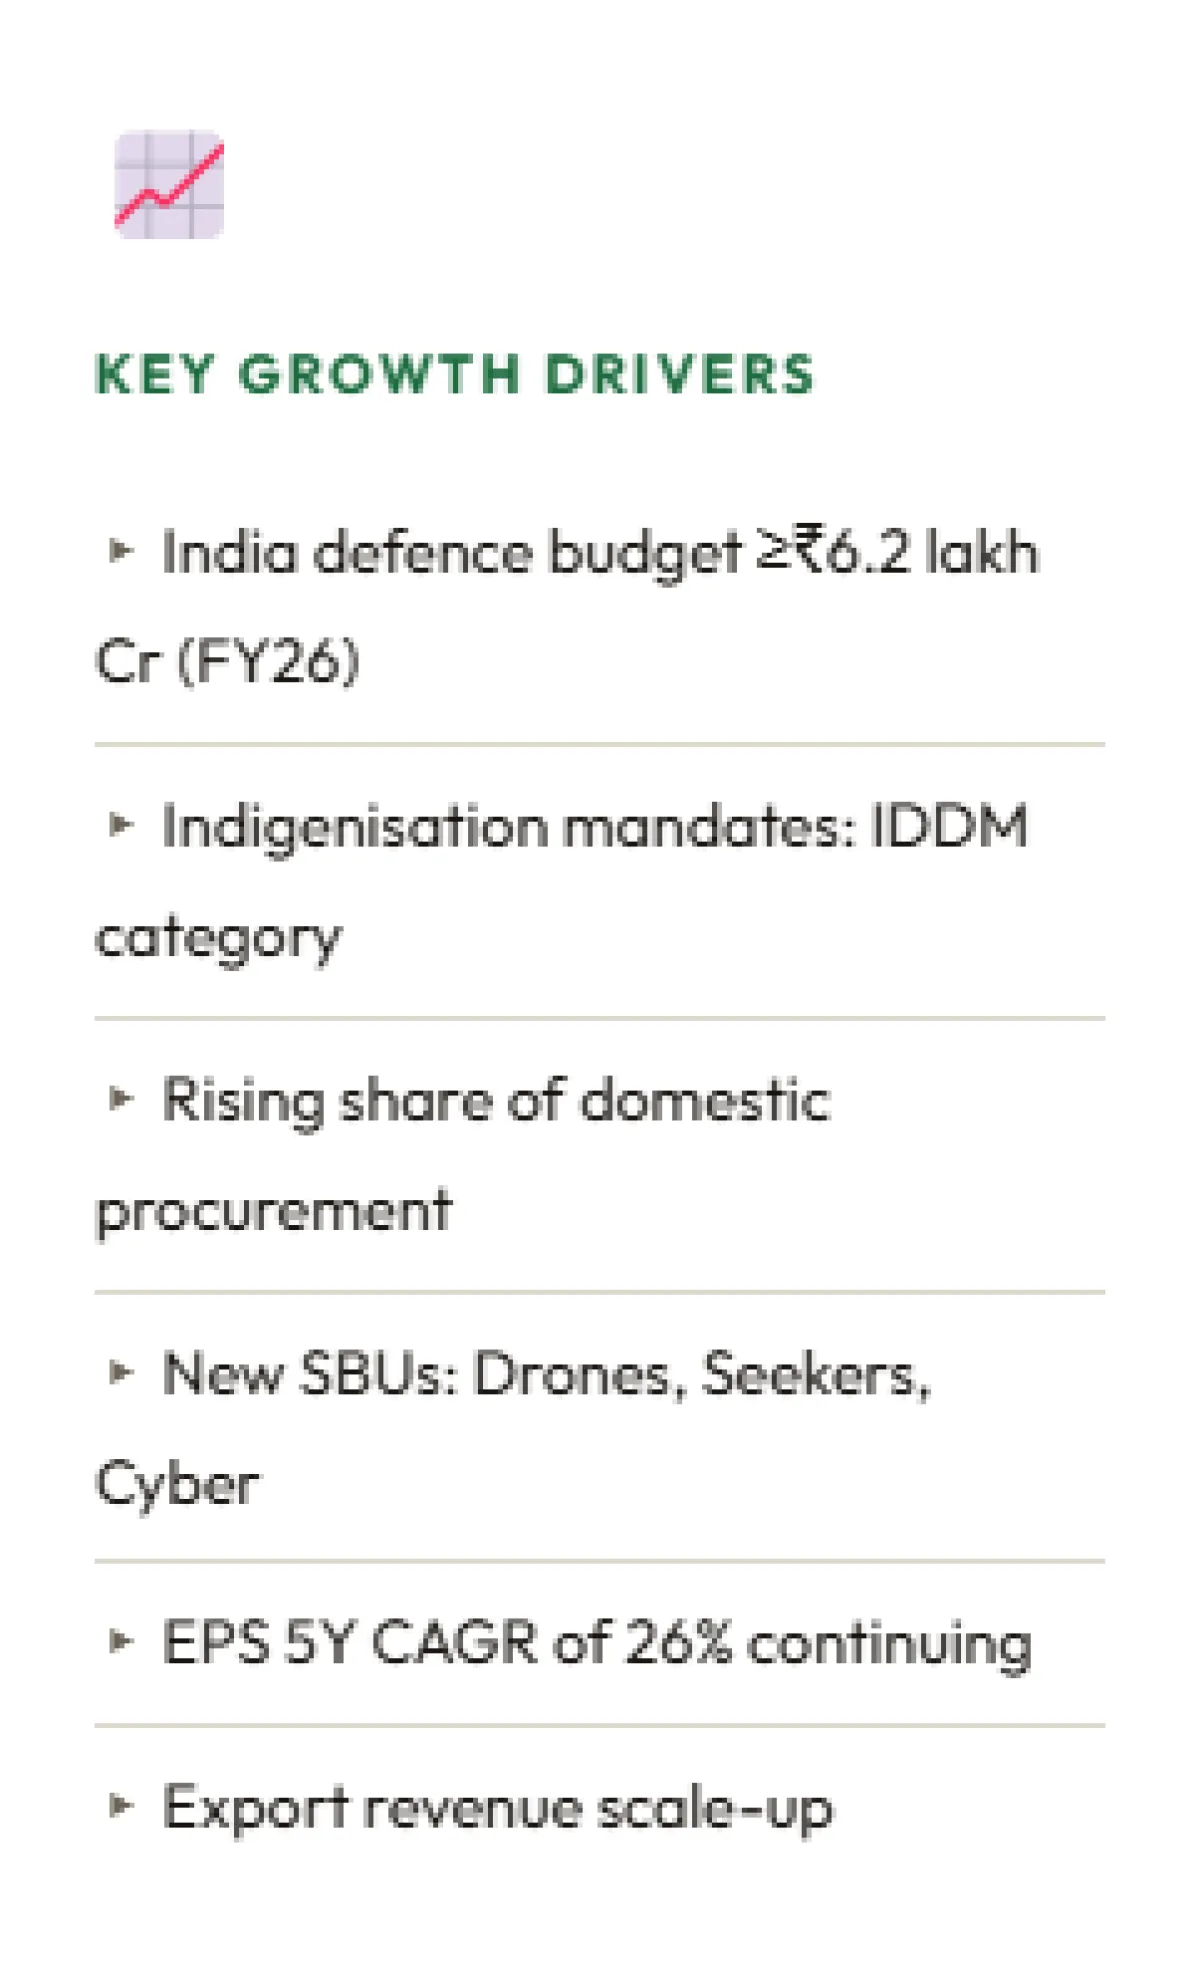
Core Investment Thesis: BEL is the best-in-class play on India's defence indigenisation mega-trend. With a ₹74,859 Cr order book, virtually debt-free balance sheet, 32.3% ROCE, and double-digit earnings growth visibility for 3–5 years, BEL offers a rare combination of quality, growth, and policy-backed structural demand. The stock's ~56× TTM P/E is elevated but justified given its compounding earnings trajectory, moat-like competitive position, and macro tailwinds from Atmanirbhar Bharat. A 19.3% upside to target ₹560 is achievable over 12–18 months driven by order execution and earnings delivery.
Industry Positioning: India's defence budget has crossed ₹6.2 lakh crore in FY26, with capital expenditure now consistently above ₹1.72 lakh crore. The government's policy of maintaining Positive Indigenisation Lists (PIL) has created a structural demand moat for domestic suppliers like BEL. As the primary supplier of defence electronics to the Indian Armed Forces for over 70 years, BEL possesses institutional knowledge, trusted relationships, and production certifications that cannot be replicated quickly by private sector entrants.
Valuation & Recommendation
Valuation Methodology:
Method
Rationale
Implied Value
P/E (Forward FY27E)
25× FY27E EPS of ~₹9.5 (based on 26% CAGR moderation to ~20%)
~₹550–560
DCF Valuation
15% revenue CAGR over 5Y, terminal growth 7%, WACC 12%
One of the most strategically important companies in India, Bharat Electronics Limited is a Navratna PSU that has successfully transitioned from being a niche player in the Indian defence space to being a comprehensive player in the Indian defence electronics ecosystem. Over the last five years, BEL has clocked a revenue growth of 14.7% CAGR and net profits of 26.4% CAGR. Simultaneously, it has also managed to expand operating margins from 18% to 28%, ROCEs from 18% to 35.6%, and maintained a near zero debt balance sheet. These are differentiated fundamentals indeed.
The macro scenario for BEL is as robust as it has ever been. India’s defence budget is only going up, there is regulatory protection in the form of Positive Indigenisation Lists (PILs) for domestic players, and the shift from being import-dependent to Atmanirbhar is irreversible in the next decade. BEL, being the systems integrator for the Armed Forces, is the key commercial beneficiary.
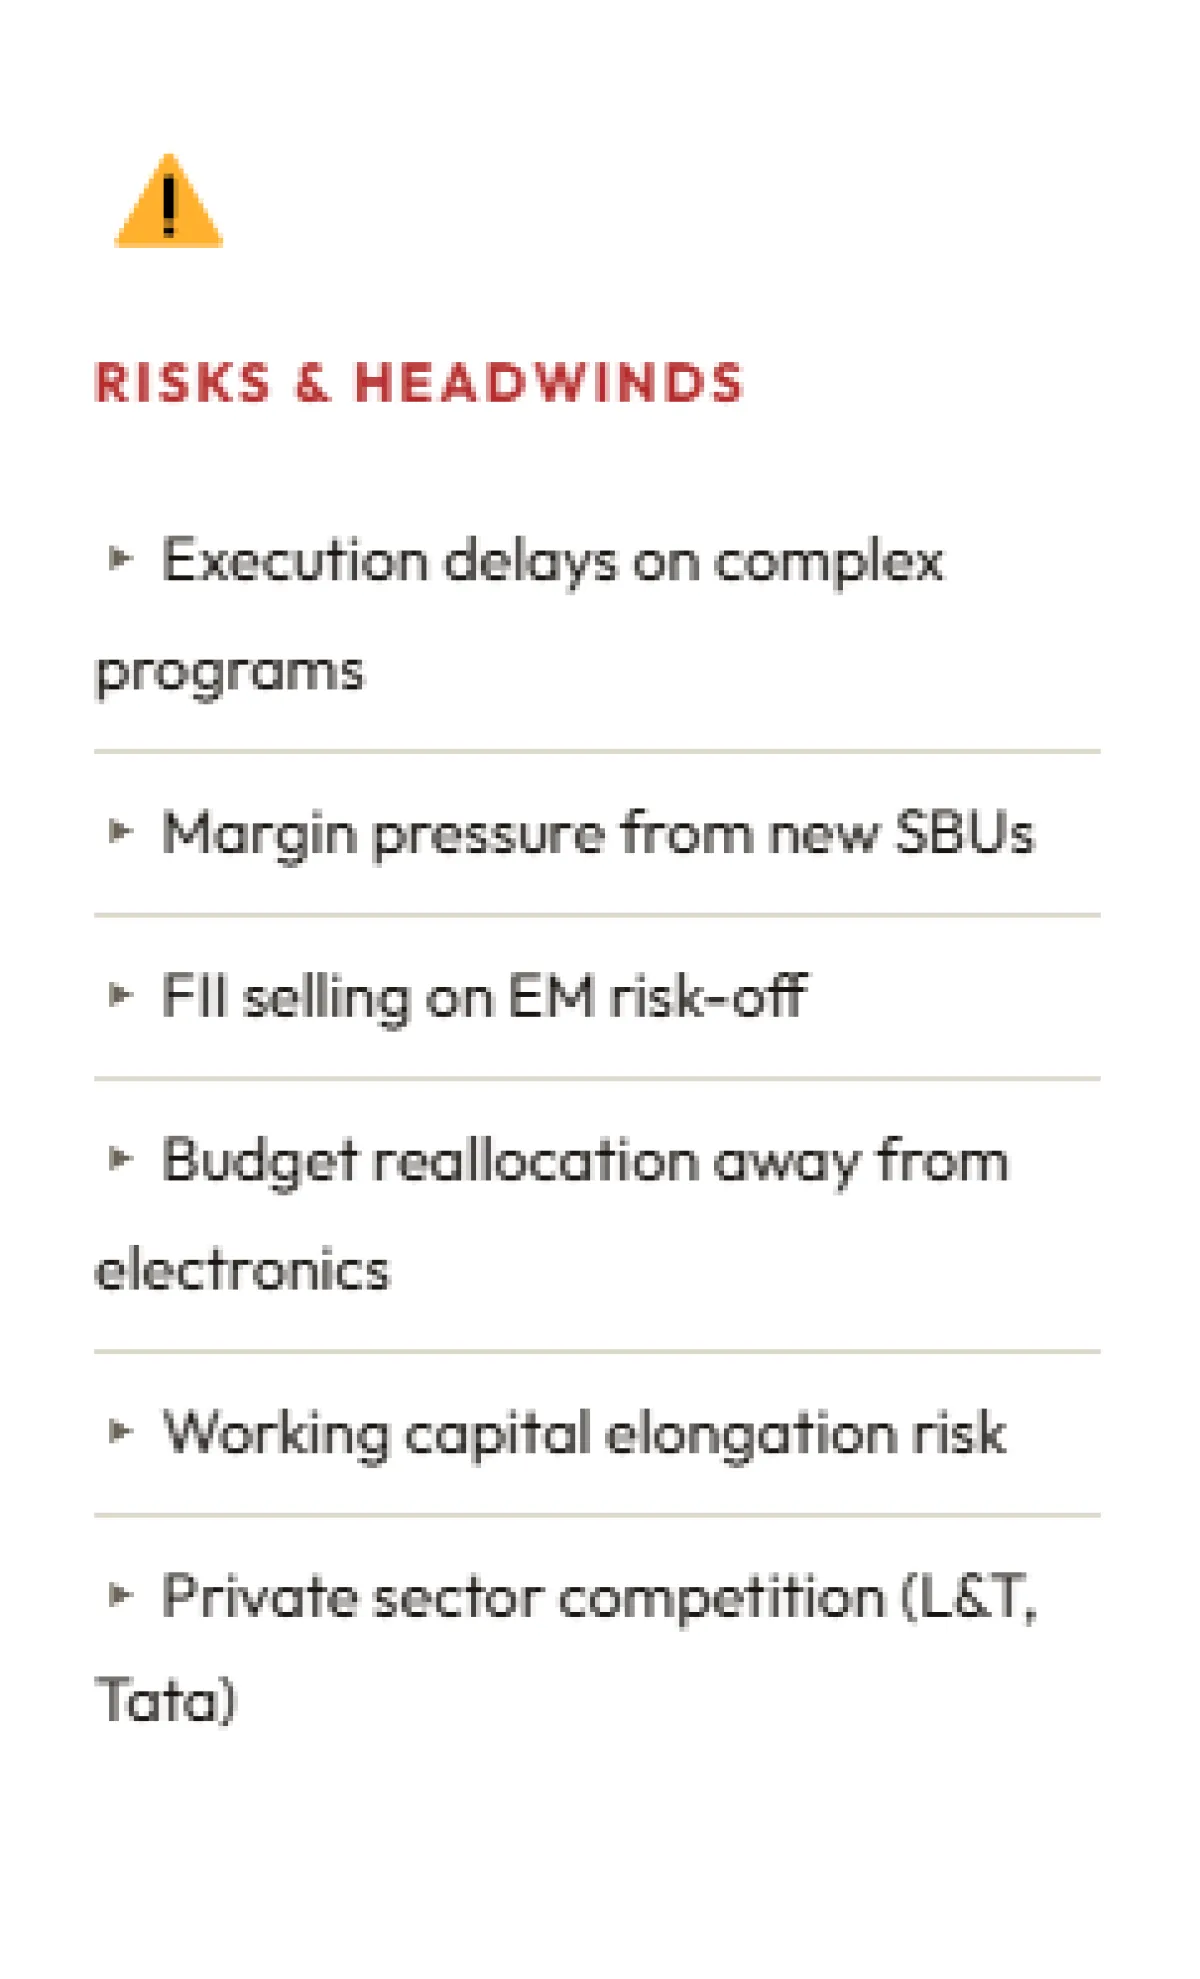
While the risks are certainly there, they are also certainly manageable. The ~56x TTM P/E requires continued execution, while the elongation of working capital in FY25 is something to watch. That said, the order book of ₹74,859 crore, or 3x annual revenues, is exceptional. Moreover, the increasing ownership by the DII community (20.5%) is a testament to the long-term institutional conviction.
With a TP of 560, or 19.3% from current levels of ~469, using a blended 25x forward P/E, DCF, and P/B approach, BEL is a high-quality compounding story in a policy-driven growth industry. The recommendation is a BUY for an investment horizon of 12 to 18 months. We recommend phased accumulation in the event of any weakness towards the 420-440 zone.
Source & DISCLAIMER
Bharat Electronics Ltd - Analysis Report Source of Financial Data: Screener.in, Equitymaster, NSE India, Dhan, TickerTape DISCLAIMER: This equity analysis report is for informational and educational purposes only. It should not be considered investment advice or a solicitation to buy or sell securities. It’s based on publicly available information and financial data from credible sources, which are believed to be accurate as of the date of publication. Estimates and target prices are subject to uncertainty. Past results are not a guarantee of future outcomes. Investors should do their own due diligence and consult a SEBI-registered investment advisor before making investment decisions. Author and publisher assume no liability for investment losses.
**Disclaimer: We are not SEBI registered. The content provided is for educational and informational purposes only and should not be considered investment advice. Stock market investments are subject to market risks. Please consult a SEBI-registered financial advisor before making investment decisions.**
InvesTalks is a powerful market learning and analysis platform built for traders, investors, and finance enthusiasts. Stay updated with real-time market insights, expert blogs, educational content, and smart investing strategies — all in one place.
ITS InvesTalks uses cookies to enhance your experience,
analyze traffic, and display relevant advertisements.
You can accept all cookies or manage your preferences.


Login to comment.