Complete technical analysis of NIFTY BANK including RSI EMA Bollinger Bands support resistance and prediction.
TODAY MARKET ANALYSIS:
Market Sentiment Overview
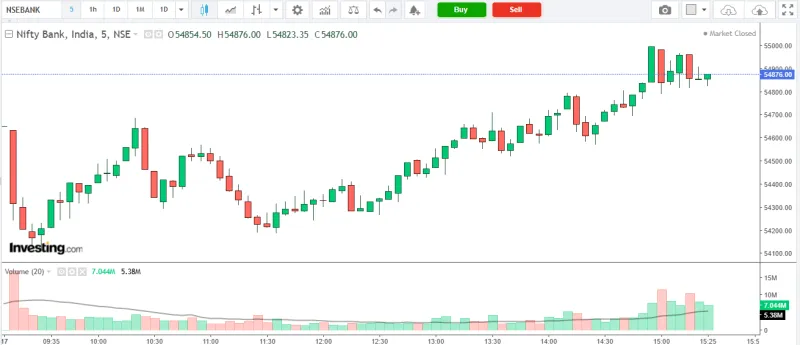
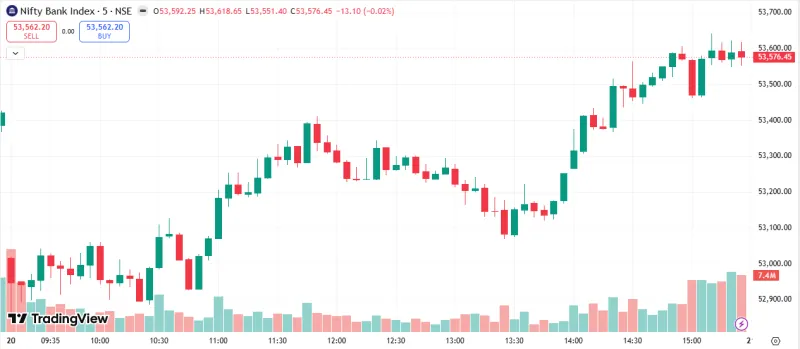
The NIFTY BANK closed at 54876.00 with a movement of 462.60 points.
Market participants remained cautious amid global uncertainty.
The index traded between 54113.15 and 54996.00 during the trading session.
Current RSI stands near 53.80, while the price is trading around the EMA20 level of 57707.63.
Overall market structure suggests bearish pressure.
Today's Market Data
Metric
Value
Index Value
54876.00
Day High
54996.00
Day Low
54113.15
RSI (14)
53.80
EMA20
57707.63
EMA50
58877.08
Bollinger Upper
63949.64
Bollinger Lower
53250.01
Support Level
53757.85
Resistance Level
61550.80
Intraday Price Action
During today's session the index traded between 54113.15 and 54996.00.
Price action indicates that traders were reacting to key technical levels while monitoring global market developments.
Intraday volatility remained moderate as investors balanced buying interest against selling pressure.
Comparison With Previous Trading Session
Compared with the previous trading session the index showed movement of 462.60 points.
This shift reflects evolving market sentiment as traders adjust positions based on economic signals and institutional flows.
Technical Indicator Analysis
Technical indicators suggest that the index is currently trading near important moving average levels.
RSI stands at 53.80 while EMA20 is located near 57707.63.
These indicators provide insight into the short term momentum and overall market strength.
RSI Momentum Analysis
The Relative Strength Index currently stands near 53.80.
An RSI reading above 70 indicates overbought conditions while values below 30 signal oversold territory.
Current levels suggest neutral momentum with the possibility of consolidation.
Moving Average Trend Analysis
Price relative to moving averages offers valuable trend insights.
Current close: 54876.00
EMA20: 57707.63
EMA50: 58877.08
When price trades below short term moving averages it often signals short term weakness.
Bollinger Band Volatility Analysis
Bollinger Bands measure market volatility.
Upper Band: 63949.64
Lower Band: 53250.01
Price movement toward the lower band may indicate support while moves toward the upper band suggest potential resistance.
Major Support and Resistance Levels
Immediate Support
53757.85
Immediate Resistance
61550.80
These levels will likely determine the next directional move in the index.
Market Intelligence Signals
Trend Signal: bearish pressure
Breakout Signal: The index remains within the consolidation range.
Reversal Signal: Momentum indicators currently show neutral conditions.
Prediction for Tomorrow
Bullish Scenario
If the index holds above 53757.85, a move toward 61550.80 could appear.
Bearish Scenario
A breakdown below 53757.85 may push prices lower.
Sideways Scenario
The market may continue consolidating between these levels until a fresh catalyst appears.
Key Takeaways for Traders
Key Observations:
Index closing level: 54876.00
RSI momentum: 53.80
Major support: 53757.85
Major resistance: 61550.80
Traders should watch these levels closely for potential breakout or reversal opportunities.
**Disclaimer: We are not SEBI registered. The content provided is for educational and informational purposes only and should not be considered investment advice. Stock market investments are subject to market risks. Please consult a SEBI-registered financial advisor before making investment decisions.**
InvesTalks is a powerful market learning and analysis platform built for traders, investors, and finance enthusiasts. Stay updated with real-time market insights, expert blogs, educational content, and smart investing strategies — all in one place.
ITS InvesTalks uses cookies to enhance your experience,
analyze traffic, and display relevant advertisements.
You can accept all cookies or manage your preferences.

 By Admin
|
Mar 17, 2026
|
5 min read
|
26
|
🤍
0
By Admin
|
Mar 17, 2026
|
5 min read
|
26
|
🤍
0

Login to comment.