
Index
- Introduction
- Market Sentiment Overview
- Today's Market Data
- Intraday Price Action
- Comparison With Previous Trading Session
- Technical Indicator Analysis
- RSI Momentum Analysis
- Moving Average Trend Analysis
- Bollinger Band Volatility Analysis
- Major Support and Resistance Levels
- Market Intelligence Signals
- Prediction for Tomorrow
- Key Takeaways for Traders
NIFTY 50 Market Analysis – 01 April 2026
Introduction
Market Sentiment Overview
Today's Market Data
Intraday Price Action
Comparison With Previous Trading Session
Technical Indicator Analysis
RSI Momentum Analysis
Moving Average Trend Analysis
Bollinger Band Volatility Analysis
Major Support and Resistance Levels
Market Intelligence Signals
Prediction for Tomorrow
Key Takeaways for Traders
 By Admin
|
Apr 01, 2026
|
5 min read
|
93
|
🤍
0
By Admin
|
Apr 01, 2026
|
5 min read
|
93
|
🤍
0
Complete technical analysis of NIFTY 50 including RSI EMA Bollinger Bands support resistance and prediction.
01 April 2026 Nifty50 MARKET ANALYSIS:
Market Sentiment Overview
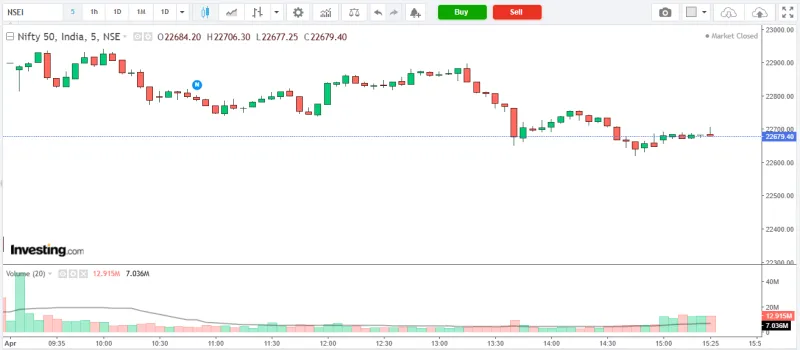
The NIFTY 50 closed at 22679.40 with a movement of 348.00 points. Investors adopted a wait and watch approach throughout the session. The index traded between 22618.60 and 22941.30 during the trading session. Current RSI stands near 50.22, while the price is trading around the EMA20 level of 23550.26. Overall market structure suggests bearish pressure.Today's Market Data
| Metric | Value |
|---|---|
| Index Value | 22679.40 |
| Day High | 22941.30 |
| Day Low | 22618.60 |
| RSI (14) | 50.22 |
| EMA20 | 23550.26 |
| EMA50 | 24449.48 |
| Bollinger Upper | 25230.42 |
| Bollinger Lower | 22131.74 |
| Support Level | 22331.40 |
| Resistance Level | 25178.65 |
Intraday Price Action
During today's session the index traded between 22618.60 and 22941.30. Price action indicates that traders were reacting to key technical levels while monitoring global market developments. Intraday volatility remained moderate as investors balanced buying interest against selling pressure.Comparison With Previous Trading Session
Compared with the previous trading session the index showed movement of 348.00 points. This shift reflects evolving market sentiment as traders adjust positions based on economic signals and institutional flows.Technical Indicator Analysis
Technical indicators suggest that the index is currently trading near important moving average levels. RSI stands at 50.22 while EMA20 is located near 23550.26. These indicators provide insight into the short term momentum and overall market strength.RSI Momentum Analysis
The Relative Strength Index currently stands near 50.22. An RSI reading above 70 indicates overbought conditions while values below 30 signal oversold territory. Current levels suggest neutral momentum with the possibility of consolidation.Moving Average Trend Analysis
Price relative to moving averages offers valuable trend insights. Current close: 22679.40 EMA20: 23550.26 EMA50: 24449.48 When price trades below short term moving averages it often signals short term weakness.Bollinger Band Volatility Analysis
Bollinger Bands measure market volatility. Upper Band: 25230.42 Lower Band: 22131.74 Price movement toward the lower band may indicate support while moves toward the upper band suggest potential resistance.Major Support and Resistance Levels
Immediate Support 22331.40 Immediate Resistance 25178.65 These levels will likely determine the next directional move in the index.Market Intelligence Signals
Trend Signal: bearish pressure Breakout Signal: The index remains within the consolidation range. Reversal Signal: Momentum indicators currently show neutral conditions.Prediction for Tomorrow
Bullish Scenario If the index holds above 22331.40, a move toward 25178.65 could appear. Bearish Scenario A breakdown below 22331.40 may push prices lower. Sideways Scenario The market may continue consolidating between these levels until a fresh catalyst appears.Key Takeaways for Traders
Key Observations: Index closing level: 22679.40 RSI momentum: 50.22 Major support: 22331.40 Major resistance: 25178.65 Traders should watch these levels closely for potential breakout or reversal opportunities.⚠️
Financial & Regulatory Disclaimer
InvesTalks provides stock market analysis, equity research, and financial content strictly for educational and informational purposes only. We are not a SEBI-registered investment advisor or portfolio manager. Market investments are subject to market risks. Always perform your own research or consult a certified SEBI-registered financial advisor before making buy/sell decisions.
PREVIOUS
What is the Stock Market and How Does It Work in India?
NEXTNIFTY BANK Market Analysis – 01 April 2026
Admin
Equity Research & Financial AnalysisCurated by the InvesTalks financial analysis team. Dedicated to providing disciplined stock market insights, technical chart evaluations, and long-term investor education.
 Market News & Outlook
Login to comment.