
Index
- Introduction
- 1. Executive Market Summary: August 21, 2026 Scorecard
- 2. Macro Catalysts & Intermarket Dynamics
- 3. Multi-Timeframe Price Action Anatomy (Daily, 60-Min, 15-Min)
- 4. Indicator-by-Indicator Technical Deconstruction
- 5. Derivatives Landscape: Option Chain, PCR & Open Interest Architecture
- 6. Sectoral Heatmap & Market Breadth Breakdown
- 7. Definitive Support & Resistance Level Grid
- 8. Probabilistic Scenarios for Monday's Session (August 24, 2026)
- 9. Risk Architecture & Volatility Sizing Principles
- 10. Frequently Asked Questions (FAQs)
Nifty 50 Consolidates Gains 21 August 2026 : In-Depth Technical Analysis & Monday Outlook
 By Admin
|
Aug 21, 2026
|
1 min read
|
262
|
🤍
0
By Admin
|
Aug 21, 2026
|
1 min read
|
262
|
🤍
0
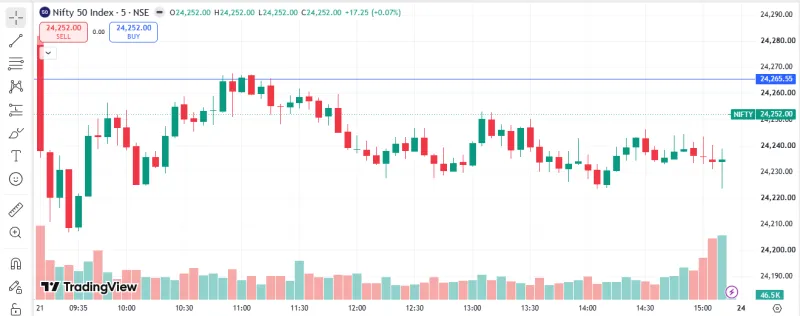
The Indian equity benchmark Nifty 50 concluded a quiet, range-bound Friday session on August 21, 2026, gaining 20.15 points (+0.08%) to settle at 24,252.00. Following Thursday’s explosive short-covering bounce off the 24,000 structural bedrock—which snapped a grueling 7-day losing streak—the index spent Friday digesting recent gains in a tight 105-point trading band.
While global macroeconomic headwinds persisted—including Brent crude oil holding elevated near $93.80 per barrel, elevated US 10-Year Treasury yields (4.39%), and anticipation surrounding global central bank commentary—the domestic market demonstrated underlying strength. Bank Nifty led outperformance (+0.46%), Metals (+0.86%) and Realty (+0.75%) witnessed steady accumulation, and the Nifty 50 successfully defended its 50-day Exponential Moving Average (24,228) on a weekly closing basis.
This comprehensive technical research dossier provides an exhaustive multi-timeframe examination of the Nifty 50, integrating Classical Price Action Geometry, Bollinger Bands (20, 2), Volume Spread Analysis (VSA), Relative Strength Index (RSI 14), Moving Average Ribbons (EMA 20/50/100/200), Central Pivot Range (CPR), and Derivatives Option Chain metrics to define exact structural support and resistance boundaries and map out probabilistic market movement scenarios for Monday's session (August 24, 2026).
1. Executive Market Summary: August 21, 2026 Scorecard
The Nifty 50 opened Friday's session at 24,285.40, tested an intraday high of 24,312.40, dipped to an intraday low of 24,206.80 around mid-day, and rebounded into the closing bell to close at 24,252.00.
Market Index Snapshot — August 21, 2026
| Index / Metric | August 21, 2026 Value | Previous Close | Net Change | Direction |
|---|---|---|---|---|
| Nifty 50 (NSE Spot) | 24,252.00 | 24,231.85 | +20.15 (+0.08%) | 🟢 |
| BSE Sensex | 77,540.83 | 77,537.72 | +3.11 (+0.00%) | 🟢 |
| Nifty Bank | 57,761.95 | 57,495.90 | +266.05 (+0.46%) | 🟢 |
| Nifty Midcap 100 | 58,145.20 | 58,080.10 | +65.10 (+0.11%) | 🟢 |
| Nifty Smallcap 100 | 18,485.60 | 18,410.25 | +75.35 (+0.41%) | 🟢 |
| India VIX | 11.82 | 12.05 | -0.23 (-1.91%) | 📉 |
| NSE Market Breadth | Advances: 1,885 | Declines: 1,634 | Ratio: 1.15 (Positive) | 🟢 |
Quick Market Reading
| Factor | Reading |
|---|---|
| Nifty 50 | 🟢 Marginally Positive |
| Banking | 🟢 Strongest major index |
| Midcap | 🟢 Mildly Positive |
| Smallcap | 🟢 Outperforming |
| India VIX | 📉 Falling — Lower Volatility |
| Market Breadth | 🟢 Positive |
| Overall Market Bias | 🟢 Mildly Bullish / Positive |
The intraday range narrowed to 105.60 points, signaling temporary equilibrium between buyers and sellers following Thursday's strong reversal candle.
2. Macro Catalysts & Intermarket Dynamics
GLOBAL MACRO TRANSMISSION CHANNELS
| Macro Driver | Transmission Channel | Market Impact |
|---|---|---|
| 🛢️ Brent Crude: ~$93.80/bbl | → Import Inflation Pressure | → Cap on Heavyweight Upside |
| 🇺🇸 US 10Y Yields: 4.39% | → Global Risk-Off Posturing | → Range-Bound Consolidation |
A. Energy Volatility: Crude Nears $94/bbl
Brent crude futures hovered near $93.80 per barrel due to ongoing Middle East supply concerns. High crude prices continue to cap aggressive upside momentum in consumer staples, paints, and energy-consuming industrials.
B. Sovereign Bond Yields & Currency
The US 10-Year Treasury yield held steady at 4.39%, keeping global capital flows selective. The Indian Rupee traded near 83.92 against the US Dollar, supported by intervention and strong domestic institutional liquidity.
C. Institutional Flow Dynamics (FII vs. DII)
- Foreign Institutional Investors (FIIs): Net cash selling slowed down substantially, recording a modest outflow of ₹-583.36 Crore in recent sessions.
- Domestic Institutional Investors (DIIs): Domestic mutual funds and insurance firms maintained relentless net buying, deploying +₹3,537.71 Crore in cash equities to absorb foreign distribution.
3. Multi-Timeframe Price Action Anatomy (Daily, 60-Min, 15-Min)
A multi-timeframe perspective clarifies where the index stands within its structural cycle:
Daily Timeframe — Doji Consolidation Above 50 EMA & 24,000 Base
| Price Level | Technical Structure | Interpretation |
|---|---|---|
| 24,850 | Lower High 1 | 🔴 Initial resistance / previous swing high |
| 24,580 | Lower High 2 | 🔴 Secondary resistance |
| 24,360 | Lower High 3 | 🔴 Immediate overhead resistance |
| 24,252.00 | Today's Close — Doji Consolidation | 🟡 Holding above 50 EMA |
| 24,000 | Strong 100 EMA Bedrock | 🟢 Major structural support |
Price Structure
| Component | Reading |
|---|---|
| Current Close | 24,252.00 |
| Trend Structure | Lower highs |
| 50 EMA | 🟢 Holding |
| 100 EMA / 24,000 Base | 🟢 Strong support |
| Candle Structure | 🟡 Doji / Consolidation |
| Immediate Resistance | 24,360 |
| Major Resistance | 24,580 → 24,850 |
| Overall Bias | 🟡 Neutral to Mildly Bullish Above 24,000 |
A. Daily Timeframe Analysis: Inside Bar / Doji Formation
- Candlestick Morphology: Friday’s daily candle printed a High-Wave Doji / Inside Bar, remaining completely contained within Thursday’s wide-range bullish engulfing candle (24,025 to 24,310). In classical price action, an Inside Bar following a hammer reversal indicates trend consolidation before the next directional leg.
- Reclaiming the 50 EMA: The Nifty 50 successfully closed above its 50-day Exponential Moving Average (24,228) for the second straight session, neutralizing immediate breakdown fears.
- Weekly Closing Picture: On the weekly chart, Nifty formed a long lower shadow candle right at the 24,000 demand base, reaffirming that long-term structural buyers consider 24,000 an attractive accumulation zone.
B. 60-Minute (Hourly) Timeframe: Base Building & Order Blocks
- Bullish Order Block (Demand Base): The hourly chart established a firm demand base between 24,180 and 24,210. Intraday dips into this zone on Friday were met with prompt buying absorption.
- Overhead Hourly Resistance: A supply block remains active between 24,320 and 24,360. A 60-minute close above 24,360 is required to trigger momentum toward 24,500.
C. 15-Minute Intraday Microstructure
- 09:15 – 10:30: Nifty opened with a mild gap-up, hit an early high of 24,312.40, but failed to clear Thursday's high (24,315), leading to profit booking.
- 10:30 – 13:30: Controlled pullbacks dragged the index to a low of 24,206.80, where buyers stepped in near VWAP and the 50 EMA.
- 13:30 – 15:30: Steady recovery in the final two hours pushed price back into positive territory to close at 24,252.00.
4. Indicator-by-Indicator Technical Deconstruction
Below is a detailed analysis of key technical indicators across daily and hourly timeframes.
Technical Indicator Snapshot — August 21, 2026
| Technical Indicator | Current Value / Setting | Historical Regime | Technical Signal |
|---|---|---|---|
| Bollinger Bands (20, 2) | Upper: 24,740Middle: 24,380Lower: 24,020 | — | — |
| BB Bandwidth (BBW) | 2.96% | Contracting | 🟡 Volatility Base |
| %B Indicator | 0.322 | Lower-Middle Zone | 🟡 Neutralizing |
| RSI (14-Period, Daily) | 45.80 | Rebounding from Oversold | 🟡 Neutral Recovery |
| RSI (14-Period, 60-Min) | 52.30 | Bullish Half (>50) | 🟢 Positive Bias |
| 20-Day EMA | 24,395.00 | Price < 20 EMA | 🔴 Overhead Supply |
| 50-Day EMA | 24,228.00 | Price > 50 EMA | 🟢 Immediate Support |
| 100-Day EMA | 23,998.00 | Price > 100 EMA | 🟢 Major Structural Base |
| 200-Day EMA | 23,355.00 | Price > 200 EMA | 🟢 Macro Trend Floor |
| MACD (12, 26, 9) | Line: -68.20Signal: -52.00Histogram: -16.20 | — | 🟢 Bullish Convergence |
| Daily CPR (Monday) | TC: 24,254P: 24,257BC: 24,259 | Extremely Narrow | 🟡 Breakout Watch |
| India VIX | 11.82 | Low Volatility Tier | 🟡 Compression Phase |
A. Bollinger Bands (20, 2) & Volatility Compression Analysis
BOLLINGER BANDS (20, 2) DAILY POSTURE
24,740 -------- Upper Band (+2σ)
\
24,380 -------- 20 SMA Midline (Immediate Pullback Target)
\
24,252 ===== [ CURRENT SPOT: 24,252.00 ]
\
24,020 --------- Lower Band (-2σ)
- The %B Metric (0.322): The %B indicator has recovered from extreme oversold territory (<0.10) to 0.322, confirming that price is moving out of the lower volatility extreme back toward the 20-day SMA midline (24,380).
- Bandwidth Contraction: After expanding during the 7-day sell-off, the Bollinger Bandwidth has started contracting to 2.96%. Band contraction after a sharp move indicates price stabilization.
B. Volume Spread Analysis (VSA) & Volume Profile Metrics
VOLUME PROFILE STRUCTURE (CURRENT SERIES)
24,550 ────── [ VAH: Value Area High ]
24,380 ▓▓▓▓▓▓ [ High Volume Node / 20 SMA ]
24,280 ▓▓▓▓▓▓ [ POC: Point of Control ]
24,252 ▓▓▓▓▓▓ [ Current Spot ]
24,000 ────── [ VAL: Value Area Low ]
- Point of Control (POC): Located at 24,280. Spot price (24,252) is trading just 28 points below the POC. A sustained move above 24,280 shifts the short-term volume profile into a bullish acceptance zone.
- Volume Spread Behavior: Volume on Friday was 15% lower than the 20-day average. Low volume during a narrow consolidation day following a major reversal candle represents classic "Low-Volume Pullback / Testing" behavior, indicating sellers are not aggressively pushing prices lower.
C. Relative Strength Index (RSI 14) Momentum Analysis
RSI (14) MOMENTUM GAUGES
70 ────── Overbought Line
52.30 ==== [ 60-MIN RSI: 52.30 ] (Bullish Regime)
50 ────── Equilibrium Threshold
45.80 ==== [ DAILY RSI: 45.80 ] (Recovering)
30 ────── Oversold Boundary
- Daily RSI (45.80): Daily RSI bounced off the oversold 36 level to cross 45. A climb above 50 would confirm momentum shifting back in favor of buyers.
- 60-Minute RSI (>50): The 60-minute RSI crossed above the 50 equilibrium mark to read 52.30, signaling underlying intraday bullish momentum on lower timeframes.
D. Exponential Moving Average (EMA) Ribbon Alignment
PRICE POSITION RELATIVE TO KEY EXPONENTIAL MOVING AVERAGES
24,395.00 ────── 20-Day EMA (Short-Term Ceiling)
24,252.00 ====== [ CURRENT SPOT: 24,252.00 ]
24,228.00 ────── 50-Day EMA (Immediate Support Floor)
23,998.00 ────── 100-Day EMA (Major Bedrock Support)
23,355.00 ────── 200-Day EMA (Macro Structural Base)
- Holding Above 50 EMA: Spot price (24,252) is holding comfortably above the 50-day EMA (24,228).
- The 20 EMA Resistance: The 20-day EMA (24,395) aligns with the 20-day SMA midline (24,380), establishing 24,380–24,400 as the primary overhead target and resistance zone.
E. MACD (12, 26, 9) Histogram Convergence
- MACD Line: Sits at -68.20 vs Signal Line at -52.00.
- Histogram: The negative histogram has shrunk from -36.10 to -16.20, signaling strong bullish momentum convergence on the daily timeframe.
F. Central Pivot Range (CPR) & Daily Pivots
Calculations for Monday's session (August 24, 2026):
Pivot (P)=High+Low+Close3=24,312.40+24,206.80+24,252.003≈24,257.07Pivot (P)=3High+Low+Close=324,312.40+24,206.80+24,252.00≈24,257.07
Bottom Central (BC)=High+Low2=24,312.40+24,206.802≈24,259.60Bottom Central (BC)=2High+Low=224,312.40+24,206.80≈24,259.60
Top Central (TC)=(Pivot−BC)+Pivot≈24,254.54Top Central (TC)=(Pivot−BC)+Pivot≈24,254.54
Nifty 50 Pivot Levels — August 21, 2026
| Pivot Level | Price (Points) | Technical Significance |
|---|---|---|
| 🔴 Resistance 3 (R3) | 24,468.25 | Major Bullish Extension Target |
| 🟠 Resistance 2 (R2) | 24,362.67 | 20-Day EMA / Supply Zone |
| 🟡 Resistance 1 (R1) | 24,307.33 | Intraday High & Immediate Barrier |
| ⚪ Central Pivot (P) | 24,257.07 | Session Equilibrium — Extremely Narrow CPR |
| 🟢 Support 1 (S1) | 24,201.73 | Friday Low & 50-Day EMA Floor |
| 🟢 Support 2 (S2) | 24,151.47 | Intermediate Demand Zone |
| 🔵 Support 3 (S3) | 24,046.13 | Major Structural Support Floor |
Key Takeaway on Monday's CPR: Monday's CPR is Extremely Narrow (only ~5 points wide). In market profiling, an ultra-narrow CPR following a consolidation day indicates High Probability of a Directional Breakout Session on Monday.
5. Derivatives Landscape: Option Chain, PCR & Open Interest Architecture
Next Weekly Option Open Interest Distribution
| Strike Price | Call OI (CE) | Call OI Signal | Put OI (PE) | Put OI Signal |
|---|---|---|---|---|
| 24,500 | 14.2M | 🔴 Strong Resistance Wall | — | — |
| 24,400 | 9.6M | 🔴 Resistance | — | — |
| 24,300 | 11.5M | 🔴 Major Resistance | 6.8M | 🟢 Support |
| 24,200 | — | — | 12.8M | 🟢 Strong Support |
| 24,100 | — | — | 7.9M | 🟢 Support |
| 24,000 | — | — | 16.5M | 🟢 Major Support Floor |
Open Interest Interpretation
| Level | Interpretation |
|---|---|
| 24,500 CE — 14.2M | 🔴 Strongest visible Call resistance |
| 24,300 CE — 11.5M | 🔴 Significant overhead supply |
| 24,200 PE — 12.8M | 🟢 Strong Put support |
| 24,000 PE — 16.5M | 🟢 Largest Put support wall |
| Likely OI Range | 24,000 – 24,500 |
| Current Spot | 24,252 |
| Overall OI Structure | 🟡 Range-bound with 24,000 support and 24,300–24,500 resistance |
A. Put-Call Ratio (PCR) Recovery
- Current Total PCR (OI): 0.92
- Interpretation: PCR recovered from an oversold 0.68 to 0.92, reflecting a healthy, balanced market posture with steady put writing supporting lower strikes.
B. Strike-Wise Open Interest Concentration
- The 24,200 & 24,000 Put Floors: The 24,200 PE strike holds 12.8 Million contracts, providing immediate intraday support. The 24,000 PE strike remains the major structural wall with 16.5 Million contracts.
- The 24,300 & 24,500 Call Walls: The 24,300 CE strike holds 11.5 Million contracts, while 24,500 CE holds 14.2 Million contracts.
- Max Pain Strike: Sits at 24,300, aligning with technical resistance levels.
6. Sectoral Heatmap & Market Breadth Breakdown
Sector Performance & Technical Bias — August 21, 2026
| Sector Index | Today's Change (%) | Technical Bias | Key Leaders |
|---|---|---|---|
| Nifty Bank | +0.46% 🟢 | Outperforming Base | KOTAKBANK, HDFCBANK |
| Nifty Metal | +0.86% 🟢 | Strong Momentum | TATASTEEL, JSWSTEEL |
| Nifty Realty | +0.75% 🟢 | Recovery Phase | DLF, LODHA |
| Nifty Financial Services | +0.32% 🟢 | Positive Support | HDFCLIFE, SBIN |
| Nifty Pharma | -0.15% 🔴 | Mild Profit Booking | CIPLA, SUNPHARMA |
| Nifty FMCG | -0.28% 🔴 | Consolidating | ITC, HINDUNILVR |
| Nifty IT | -0.42% 🔴 | Underpressure | HCLTECH, TCS |
| Nifty Auto | -0.55% 🔴 | Profit Booking Drag | MARUTI, M&M |
- Banking & Metal Leadership: Bank Nifty (+0.46%) and Metals (+0.86%) led the market support, offsetting weakness in Auto (-0.55%) and IT (-0.42%).
7. Definitive Support & Resistance Level Grid
Nifty 50 Key Price Levels & Confluence Zones — August 21, 2026
| Level Classification | Exact Price Zone | Confluence Factors |
|---|---|---|
| 🔴 Major Resistance 3 (R3) | 24,460 – 24,500 | 24,500 Call Wall + VAH + Pivot R3 |
| 🟠 Intermediate Resistance 2 (R2) | 24,360 – 24,395 | 20-Day EMA + 20 SMA Midline + Pivot R2 |
| 🟡 Immediate Resistance 1 (R1) | 24,300 – 24,315 | Friday High + 24,300 CE Wall + Pivot R1 |
| ⚪ CURRENT SPOT PRICE | 24,252.00 | Holding 50-Day EMA (24,228) |
| 🟢 Immediate Support 1 (S1) | 24,200 – 24,210 | Friday Low + 24,200 PE Wall + Pivot S1 |
| 🟢 Intermediate Support 2 (S2) | 24,140 – 24,155 | Hourly Order Block + Pivot S2 |
| 🔵 Major Structural Base (S3) | 23,980 – 24,000 | 100-Day EMA + 16.5M Put Open Interest Wall |
8. Probabilistic Scenarios for Monday's Session (August 24, 2026)
| Scenario | Probability | Market Condition | Key Trigger | Target / Strategy |
|---|---|---|---|---|
| 🟢 A — Bullish Continuation | 50% | Bullish | Sustains above 24,315 | 24,380 → 24,450 |
| 🔴 B — Bearish Retest | 30% | Bearish | Breaks below 24,200 | 24,140 → 24,050 |
| 🟡 C — Range Consolidation | 20% | Sideways | Chops within 24,200–24,310 | Theta Decay Focus |
🟢 Scenario A: Bullish Breakout & Continuation (50% Probability)
- Pre-Conditions: Positive weekend global developments, stability in crude oil, and GIFT Nifty indicating a green open above 24,280.
- Technical Trigger: Nifty opens near or above the Central Pivot (24,257) and decisively breaks above 24,315 on a 15-minute closing basis during the morning session.
- Structural Targets:
- Primary Objective: 24,380 – 24,400 (20-Day EMA & 20 SMA Midline)
- Secondary Objective: 24,460 – 24,500 (Major Call Wall & VAH)
- Technical Invalidation: A failure to sustain above 24,220 invalidates the breakout setup.
🔴 Scenario B: Bearish Pullback & Retest (30% Probability)
- Pre-Conditions: Negative weekend global news, Brent crude surging past $95, or aggressive morning Call writing at 24,300 CE.
- Technical Trigger: A sustained breakdown below 24,200 on a 15-minute closing basis.
- Structural Targets:
- Primary Objective: 24,140 – 24,150 (Intermediate Support Zone)
- Secondary Objective: 24,020 – 24,050 (Lower Bollinger Band & S3 Floor)
- Technical Invalidation: A quick reclaim back above 24,250.
🟡 Scenario C: Range Consolidation & Compression (20% Probability)
- Pre-Conditions: Muted global cues ahead of economic data releases.
- Technical Dynamics: Index remains confined within the 24,200 to 24,315 corridor, building a launchpad around the ultra-narrow CPR (24,257).
9. Risk Architecture & Volatility Sizing Principles
- Ultra-Narrow CPR Alert: Monday’s CPR is extremely narrow (~5 points), indicating high probability of a strong directional move. Traders should prepare for volatility expansion.
- Respect the 50 EMA Floor: The 50-day EMA (24,228) serves as the line in the sand for short-term bulls.
- Position Sizing: Maintain disciplined risk parameters (max 1% risk per trade) to navigate potential gap openings.
10. Frequently Asked Questions (FAQs)
1. What is the current trend of Nifty 50 after Friday's close?
Nifty 50 has transitioned from a sharp 7-day sell-off into a neutral-to-bullish consolidation phase, holding above its 50-day EMA (24,228) and 100-day EMA (23,998).
2. Why is Bank Nifty outperforming Nifty 50?
Bank Nifty (+0.46%) gained strength due to buying in private banks (Kotak Bank, HDFC Bank) and strong domestic institutional inflows, offsetting weakness in IT and Auto.
3. What does an ultra-narrow CPR indicate for Monday?
An ultra-narrow CPR (~5 points) indicates tight price equilibrium, which statistically leads to a directional breakout session on the following trading day.
4. What are the key support and resistance levels for Monday?
- Immediate Support: 24,200 – 24,210
- Major Support: 23,980 – 24,000
- Immediate Resistance: 24,300 – 24,315
- Major Resistance: 24,380 – 24,400
Financial & Regulatory Disclaimer
InvesTalks provides stock market analysis, equity research, and financial content strictly for educational and informational purposes only. We are not a SEBI-registered investment advisor or portfolio manager. Market investments are subject to market risks. Always perform your own research or consult a certified SEBI-registered financial advisor before making buy/sell decisions.
Nifty 50 technical analysis August 19 2026
NEXTDhoot Transmission Stock: IPO, Listing to Present & Outlook
Admin
Equity Research & Financial AnalysisCurated by the InvesTalks financial analysis team. Dedicated to providing disciplined stock market insights, technical chart evaluations, and long-term investor education.
 Market News & Outlook
Login to comment.