
Index
- Introduction
- Executive Market Scorecard: Tuesday, September 8, 2026
- Key Macro Drivers Affecting Today's Session
- Multi-Timeframe Price Action Microstructure (Daily & 60-Min)
- Multi-Indicator Technical Analysis Deep-Dive
- Derivatives Architecture & Option Chain Open Interest (PCR 0.62)
- Sectoral Heatmap & Stock-Specific Outperformers
- Definitive Support & Resistance Grid for Wednesday, September 9, 2026
- Probabilistic Scenarios for Tomorrow (Wednesday, September 9, 2026)
Nifty 50 Analysis (Sept 8): 23,620 Support & Sept 9 Forecast
 By Admin
|
Sep 08, 2026
|
1 min read
|
3
|
🤍
0
By Admin
|
Sep 08, 2026
|
1 min read
|
3
|
🤍
0
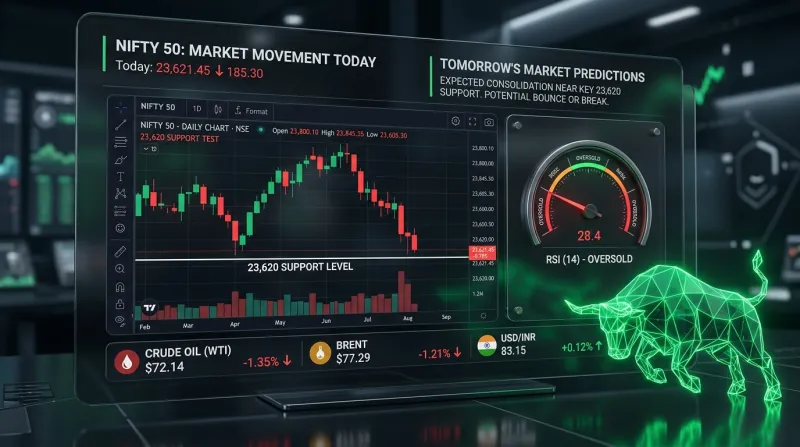
The Indian stock market experienced downside pressure during today’s session on Tuesday, September 8, 2026. The Nifty 50 index slipped 144.05 points (-0.61%) to close at 23,635.10, while the BSE Sensex dropped 555.23 points (-0.73%) to settle at 75,577.58.
Selling pressure was concentrated in banking heavyweights (ICICI Bank -1.97%, Axis Bank -1.67%) and oil & gas stocks, driven by elevated Brent crude oil prices (93.00/bbl) and persistent Middle East geopolitical friction.
Intraday price action saw the index open at 23,743.10, reach a session high of 23,758.95, and touch a low of 23,623.10 before consolidating near the 23,600 – 23,630 key demand floor. Notably, broader markets showed relative resilience, with Nifty MidCap (+0.26%) and Nifty SmallCap (+0.09%) holding in the green.
With the Daily RSI dipping into sub-30 oversold territory (29.80) and the Put-Call Ratio (PCR) dropping to an extreme 0.62, technical setup indicators suggest a potential short-covering environment for Wednesday, September 9, 2026.
This comprehensive research report on Investalks.in provides an organic multi-indicator technical breakdown of Nifty 50 for Tuesday, September 8, 2026, evaluating Bollinger Bands (20, 2), RSI (14), EMA Ribbons, Central Pivot Range (CPR), Option Chain Open Interest, and decision-tree probabilistic scenarios for tomorrow (Wednesday, September 9, 2026).
Executive Market Scorecard: Tuesday, September 8, 2026
| Index Metric | September 8, 2026 Value | Previous Close | Net Change |
|---|---|---|---|
| Nifty 50 (NSE Spot) | 23,635.10 | 23,779.15 | -144.05 (-0.61%) 🔴 |
| BSE Sensex | 75,577.58 | 76,132.81 | -555.23 (-0.73%) 🔴 |
| Nifty Bank | 56,710.20 | 56,980.40 | -270.20 (-0.47%) 🔴 |
| Nifty Midcap 100 | 57,920.40 | 57,770.15 | +150.25 (+0.26%) 🟢 |
| Nifty Smallcap 100 | 18,260.10 | 18,244.15 | +15.95 (+0.09%) 🟢 |
| India VIX (Volatility) | 12.15 | 11.85 | +0.30 (+2.53%) 📈 |
| NSE Market Breadth | Advances: 1,320 | Declines: 2,180 | Ratio: 0.60 (Neg) |
Key Macro Drivers Affecting Today's Session
MACRO CATALYSTS IMPACTING MARKET TODAY
Geopolitical Energy Shock ──► Brent crude oil ($91.50–$93.00/bbl) pressures oil importers.
Banking Sector Drag ──► ICICI Bank (-1.97%) & Axis Bank (-1.67%) drag benchmarks down.
Broader Market Resilience ──► Midcap (+0.26%) & Smallcap (+0.09%) hold positive breadth.
Defense & FMCG Outperform ──► BEL (+1.62%) & HUL (+1.02%) attract defensive buying.
- Geopolitical Energy Pressure: Continued geopolitical tension in the Middle East maintained upward pressure on Brent crude oil futures (93.00/bbl), creating margin headwinds for Indian corporate heavyweights.
- Banking & Financial Drag: Major private sector banks experienced profit-taking, dragging the Nifty Bank index down by -0.47%.
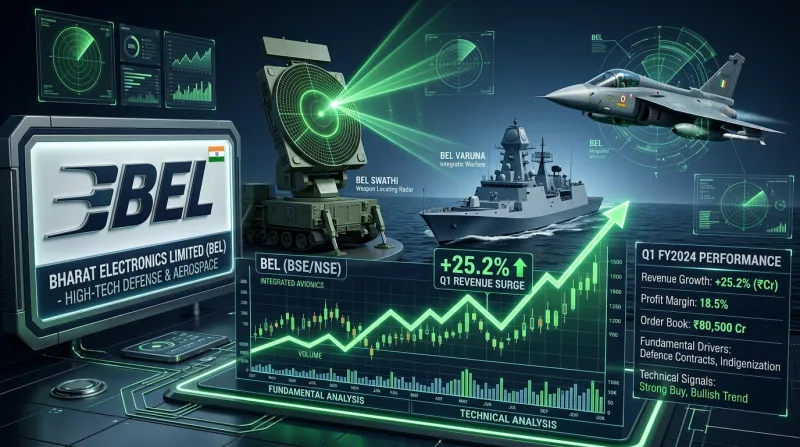
- Defense Acquisition Boost: Defensive and state-owned defense stocks outperformed, led by Bharat Electronics Limited (BEL +1.62%) following positive government defense procurement announcements. Read detailed sector reports on Investalks.in Stock Analysis.
Multi-Timeframe Price Action Microstructure (Daily & 60-Min)
DAILY TIMEFRAME: BEARISH EXTENSION TESTING 23,600 – 23,620 STRUCTURAL SUPPORT
24,290 ─ 20-Day EMA Overhead Barrier)
23,860 ─ 100-Day SMA Previous Support)
23,635 = SEPTEMBER 8 CLOSE: 23,635.10
23,623 ─ Intraday Low (Demand Support Base)
23,380 ─ 200-Day EMA Macro Bull Floor
- Daily Candlestick Pattern: The daily chart printed a Red Marubozu-style Bearish Candle closing near its session low (23,623.10).
- Structural Support Retest: Price action is retesting the critical 23,600 – 23,620 support cluster, which corresponds to previous demand bases and key option open interest walls.
Multi-Indicator Technical Analysis Deep-Dive
| Technical Indicator | Current Value / Setting | Historical Regime | Technical Signal |
|---|---|---|---|
| Bollinger Bands (20, 2) | Upper: 24,600 | Middle: 24,260 | Lower: 23,620 |
| %B Indicator | 0.042 | Extreme Oversold | Rebound Posture 🟢 |
| RSI (14-Period, Daily) | 29.80 | Sub-30 Oversold | High-Prob Bounce 🟢 |
| RSI (14-Period, 60-Min) | 34.20 | Turning Upward | Positive Divergence |
| 20-Day EMA | 24,290.00 | Price < 20 EMA | Major Supply Zone |
| 50-Day EMA | 24,175.00 | Price < 50 EMA | Major Ceiling |
| 100-Day EMA | 23,965.00 | Price < 100 EMA | Resistance Zone |
| 100-Day SMA | 23,860.00 | Price < 100 SMA | Immediate Hurdle |
| 200-Day EMA | 23,380.00 | Price > 200 EMA | Macro Bull Floor |
| MACD (12, 26, 9) | Line: -94.20 | Sig: -66.1 | Histogram: -28.10 | Compression Zone | — |
| Daily CPR (Sept 9) | TC: 23,653 | P: 23,672 | BC: 23,691 | Width: ~37 points | — |
| India VIX | 12.15 | Low Volatility Tier | Risk-Off Compression |
1. Bollinger Bands (20, 2) Analysis
- Lower Rail Retest: Spot price (23,635.10) is riding the lower Bollinger Band rail at 23,620.
- %B Metric (0.042): The
%Bmetric has reached 0.042, reflecting an extreme oversold condition where historical downside expansion slows.
2. Relative Strength Index (RSI 14) Analysis
- Daily RSI (29.80): Dips below the 30 oversold threshold for the first time in several months, indicating an oversold short-covering setup.
- 60-Minute RSI (34.20): Displaying positive divergence across hourly charts into the close.
3. Central Pivot Range (CPR) for Tomorrow (Wednesday, September 9, 2026)
Calculations for Wednesday's session (September 9, 2026):
Derivatives Architecture & Option Chain Open Interest (PCR 0.62)
| Strike Price | Call Open Interest | Call Role | Put Open Interest | Put Role |
|---|---|---|---|---|
| 23,800 | 18.2M | Resistance Wall | — | — |
| 23,700 | 14.5M | Resistance Wall | — | — |
| 23,650 | 7.8M | Resistance Wall | — | — |
| 23,600 | — | — | 16.8M | Support Floor |
| 23,500 | — | — | 11.2M | Support Floor |
| 23,400 | — | — | 7.1M | Support Floor |
- Put-Call Ratio (PCR): 0.62 (Deep oversold territory, indicating heavy call writing vulnerable to short covering if resistance levels are reclaimed).
- 23,600 PE Support Wall: Holds 16.8 Million contracts, establishing 23,600 as key support.
- 23,800 CE Call Wall: Holds 18.2 Million contracts, acting as major overhead resistance.
- Max Pain Strike: Located at 23,700.
Sectoral Heatmap & Stock-Specific Outperformers
| Sector Index | Today's Change (%) | Technical Bias | Key Stocks |
|---|---|---|---|
| Nifty Defense / Media | +1.45% 🟢 | Outperforming | BEL, ZEEL |
| Nifty FMCG | +0.42% 🟢 | Defensive Inflows | HINDUNILVR, ITC |
| Nifty Midcap 100 | +0.26% 🟢 | Relative Strength | COFORGE, PERSISTENT |
| Nifty Bank | -0.47% 🔴 | Consolidated | ICICIBANK, AXISBANK |
| Nifty IT | -0.58% 🔴 | Softening | INFY, TCS |
| Nifty Energy / Oil & Gas | -1.15% 🔴 | Crude Cost Drag | RELIANCE, ONGC |
Definitive Support & Resistance Grid for Wednesday, September 9, 2026
| Level Classification | Exact Price Zone | Confluence Factors |
|---|---|---|
| Major Resistance 3 (R3) | 23,860 – 23,880 | 100-Day SMA + Daily R2 |
| Intermediate Resistance 2 | 23,720 – 23,750 | 23,700 CE Wall + Daily R1 + Tuesday High |
| Immediate Resistance 1 | 23,653 – 23,691 | Central Pivot (P) + CPR Top/Bottom |
| Current Spot Price | 23,635.10 | Retesting 23,620 Lower Band Support |
| Immediate Support 1 (S1) | 23,600 – 23,623 | 23,600 PE Wall + Tuesday Intraday Low |
| Intermediate Support 2 (S2) | 23,536 – 23,550 | 23,500 PE Wall + Daily S2 Pivot |
| Major Structural Base (S3) | 23,380 – 23,400 | 200-Day EMA Macro Bull Market Floor |
Probabilistic Scenarios for Tomorrow (Wednesday, September 9, 2026)
| Scenario | Probability | Market Condition / Trigger | Target / Expected Range |
|---|---|---|---|
| Scenario A — Oversold Short-Covering | 50% | Breaks & Holds > 23,691 | 23,750 → 23,860 |
| Scenario B — Support Base Consolidation | 35% | Holds 23,600–23,620 Floor | Range: 23,600–23,690 |
| Scenario C — Bearish Breakdown | 15% | Sustained Close < 23,580 | 23,536 → 23,400 |
🟢 Scenario A: Oversold Short-Covering Relief Bounce (50% Probability)
- Pre-Conditions (September 9): Positive overnight Asian market cues, crude oil prices stabilizing below $91.50/bbl, and GIFT Nifty indicating a green open above 23,660.
- Technical Trigger: Nifty opens near or above the Central Pivot (23,672) and decisively crosses 23,691 (Top Central CPR) on a 15-minute closing candle.
- Upside Targets:
- Primary Target: 23,720 – 23,750 (23,700 CE Wall & Daily R1)
- Secondary Target: 23,860 (100-Day SMA)
- Technical Invalidation: A breakdown back below 23,600.
🟡 Scenario B: Support Base Consolidation & Range Trade (35% Probability)
- Pre-Conditions (September 9): Muted global market cues and flat morning opening.
- Technical Trigger: Nifty dips to retest the 23,600 – 23,620 support zone in morning trade, forming a bullish rejection candle (hammer/doji).
- Upside Target: Rebound back toward 23,670 and 23,700.
- Technical Invalidation: Sustained 15-minute trading below 23,580.
🔴 Scenario C: Bearish Breakdown Below 23,580 (15% Probability)
- Pre-Conditions (September 9): Escalating geopolitical conflict, Brent crude surging past $94.00/bbl, or heavy Call writing at 23,700 CE.
- Technical Trigger: A sustained 15-minute closing breakdown below 23,580 (Daily S1 & 23,600 PE Wall).
- Downside Targets:
- Primary Target: 23,536 (23,500 PE Wall & Daily S2)
- Secondary Target: 23,380 (200-Day EMA Macro Floor)
- Technical Invalidation: A quick V-shaped reclaim back above 23,650.
❓ Frequently Asked Questions (FAQs)
Nifty 50 dropped 144.05 points (-0.61%) due to selling pressure in private banking heavyweights (ICICI Bank, Axis Bank), elevated crude oil prices (93/bbl), and geopolitical tensions.
Technical indicators suggest a 50% probability of an oversold short-covering relief bounce toward 23,720–23,750, provided Nifty holds its 23,600 support base and PCR (0.62) triggers short covering.
- Immediate Support: 23,600 – 23,623 (Tuesday Low & 16.8M Put OI Wall)
- Major Support: 23,536 – 23,550 (23,500 PE Wall)
- Immediate Resistance: 23,653 – 23,691 (Central Pivot Range)
- Major Resistance: 23,720 – 23,750 (23,700 CE Wall & Daily R1)
A Daily RSI of 29.80 indicates that Nifty 50 has entered sub-30 oversold territory, which historically correlates with short-term consolidation or price rebounds.
A PCR of 0.62 indicates an oversold market condition, where put writing is low and call writing is heavy, creating potential for a short-covering rally if resistance levels are reclaimed.
Broader markets showed resilience: the Nifty MidCap 100 index gained +0.26% and Nifty SmallCap 100 gained +0.09%, contrasting with Nifty 50's -0.61% decline.
Top gainers included Bharat Electronics (BEL +1.62%), Hindustan Unilever (HUL +1.02%), and Eicher Motors (+0.98%).
Top laggards included SBI Life (-2.04%), ICICI Bank (-1.97%), and Axis Bank (-1.67%).
The 200-day Exponential Moving Average (EMA) sits at 23,380, representing the primary structural bull market floor.
You can track real-time technical updates, CPR calculations, and stock market coverage on Investalks.in Market Wrap Hub.
Financial & Regulatory Disclaimer
InvesTalks provides stock market analysis, equity research, and financial content strictly for educational and informational purposes only. We are not a SEBI-registered investment advisor or portfolio manager. Market investments are subject to market risks. Always perform your own research or consult a certified SEBI-registered financial advisor before making buy/sell decisions.
Gold & Silver Price Today (Sept 7): Seasonality & Forecast
NEXTBharat Electronics (BEL) Analysis: ₹72K Cr Order Book, Targe...
Admin
Equity Research & Financial AnalysisCurated by the InvesTalks financial analysis team. Dedicated to providing disciplined stock market insights, technical chart evaluations, and long-term investor education.
 Market News & Outlook


Login to comment.