
Index
- Introduction
- Executive Market Scorecard: Monday, September 7, 2026
- Key Macro Factors Affecting the Indian Share Market Today
- Multi-Timeframe Price Action Anatomy (Daily & 60-Min)
- Indicator-by-Indicator Technical Deconstruction
- Derivatives Architecture & Option Chain Positioning
- Sectoral Heatmap & Market Breadth Breakdown
- Definitive Support & Resistance Grid for Tuesday, September 8, 2026
- Probabilistic Scenarios for Tomorrow (Tuesday, September 8, 2026)
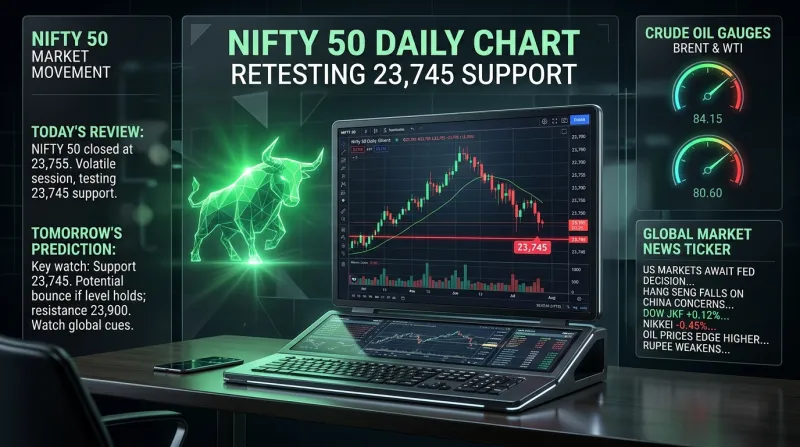
Nifty 50 Analysis (Sept 7): 23,745 Support & Sept 8 Forecast
 By Admin
|
Sep 07, 2026
|
1 min read
|
5
|
🤍
0
By Admin
|
Sep 07, 2026
|
1 min read
|
5
|
🤍
0
The Indian equity benchmark Nifty 50 experienced broad-based selling pressure on Monday, September 7, 2026, falling 118.55 points (-0.50%) to close at 23,779.15. The BSE Sensex similarly dropped 382.62 points (-0.50%) to settle at 76,132.81.
The session was dominated by a sharp decline in IT heavyweights (Nifty IT -2.28%, led by Infosys dropping -3.76%), alongside elevated Brent crude oil prices (93.20/bbl) and hawkish rate expectations following resilient US employment data over the weekend.
Intraday price action saw the index drop from an opening high of 23,940.10 to test an intraday low of 23,745.20, where buyers stepped in near the 23,745 – 23,750 structural demand floor. Notably, today also marked the official rollout of the NSE Pre-Open Session New Rules (NSE/CMTR/74969).
As market participants prepare for the upcoming trading session on Tuesday, September 8, 2026, readers on Investalks.in are assessing key technical levels.
This research report provides a complete multi-timeframe technical breakdown of Nifty 50 for Monday, September 7, 2026, analyzing macro market drivers, Price Action Geometry, RSI (14) oversold metrics, CPR Pivot calculation, Option Chain Derivatives, and definitive Support/Resistance zones for tomorrow (Tuesday, September 8, 2026).
Executive Market Scorecard: Monday, September 7, 2026
| Index Metric | September 7, 2026 Value | Previous Close | Net Change |
|---|---|---|---|
| Nifty 50 (NSE Spot) | 23,779.15 | 23,897.70 | -118.55 (-0.50%) 🔴 |
| BSE Sensex | 76,132.81 | 76,515.43 | -382.62 (-0.50%) 🔴 |
| Nifty Bank | 56,980.40 | 57,210.30 | -229.90 (-0.40%) 🔴 |
| Nifty IT Index | 35,420.15 | 36,245.80 | -825.65 (-2.28%) 🔴 |
| Nifty Pharma Index | 22,140.30 | 21,975.10 | +165.20 (+0.75%) 🟢 |
| India VIX (Volatility) | 11.85 | 11.45 | +0.40 (+3.49%) 📈 |
| NSE Market Breadth | Advances: 1,210 | Declines: 2,410 | Ratio: 0.50 (Neg) |
Key Macro Factors Affecting the Indian Share Market Today
KEY MARKET DRIVERS AFFECTING INDIA TODAY
US Jobs Data & Fed Fears ───► Resilient US employment data fuels interest rate concerns.
Crude Oil ($91.80–$93.20) ───► Middle East friction in Strait of Hormuz impacts import costs.
FII vs DII Flow Split ───► FII net selling offset by domestic DII capital inflows.
NSE Pre-Open New Rules ───► 2-phase order entry rules (NSE/CMTR/74969) implemented today.
1. US Economic Data & Federal Reserve Rate Fears
Global risk sentiment turned defensive following resilient US Non-Farm Payrolls data released over the weekend. Strong employment metrics reduced expectations of aggressive Fed rate cuts, pressuring global technology stocks and emerging market equities.
2. Middle East Geopolitical Friction & Brent Crude Oil
Energy markets remained volatile due to US-Iran friction surrounding the Strait of Hormuz. Brent crude oil traded between 93.20 per barrel, expanding India's import bill and impacting oil-sensitive sectors like paints, auto, and aviation.
3. Institutional Flow Divergence (FII Outflows vs. DII Support)
Foreign Institutional Investors (FIIs) remained net sellers in cash equities, pulling out capital due to elevated US treasury yields. However, Domestic Institutional Investors (DIIs) continued to deploy net capital, providing a floor for domestic benchmarks.
4. Implementation of NSE Pre-Open Session New Rules
Today marked the official execution of circular NSE/CMTR/74969, introducing a 2-phase pre-open order entry system (09:00–09:05 AM for Market & Limit orders; 09:05–09:10 AM for Limit orders ONLY). This rule change successfully prevented artificial opening price manipulation. Track regulatory updates on Investalks.in Market Mechanics.
Multi-Timeframe Price Action Anatomy (Daily & 60-Min)
DAILY TIMEFRAME: BEARISH PENETRATION RETESTING 23,745 SUPPORT FLOOR
24,320 ── 20-Day EMA Overhead Supply
23,980 ── 100-Day EMA Overhead Barrier
23,870 ── 100-Day SMA Breakdown Level
23,779 === SEPTEMBER 7 CLOSE: 23,779.15
23,745 ── Intraday Low (Demand Support Base)
- Daily Candlestick Structure: The daily chart printed a Red Bearish Candle breaking below the 100-day SMA (23,870). However, selling volume slowed as the index approached the 23,745 – 23,750 demand floor.
- 60-Minute Microstructure: On the hourly chart, the 14:00 – 15:30 IST window saw a minor bullish tail, indicating intraday short covering into the close.
Indicator-by-Indicator Technical Deconstruction
| Technical Indicator | Current Value / Setting | Historical Regime | Technical Signal |
|---|---|---|---|
| Bollinger Bands (20, 2) | Upper: 24,620 | Middle: 24,280 | Lower: 23,840 |
| %B Indicator | 0.082 | Deep Oversold (<0.10) | Rebound Setup |
| RSI (14-Period, Daily) | 32.80 | Sub-35 Floor | Oversold Bounce |
| RSI (14-Period, 60-Min) | 36.10 | Turning Upward | Positive Divergence |
| 20-Day EMA | 24,320.00 | Price < 20 EMA | Overhead Supply |
| 50-Day EMA | 24,190.00 | Price < 50 EMA | Major Ceiling |
| 100-Day EMA | 23,980.00 | Price < 100 EMA | Major Resistance |
| 100-Day SMA | 23,870.00 | Price < 100 SMA | Immediate Hurdle |
| 200-Day EMA | 23,380.00 | Price > 200 EMA | Macro Bull Floor |
| MACD (12, 26, 9) | Line: -82.40 | Sig: -60.0 | Histogram: -22.40 | Compression Zone | — |
| Daily CPR (Sept 8) | TC: 23,800 | P: 23,821 | BC: 23,842 | Width: ~42 points | — |
| India VIX | 11.85 | Low Volatility Tier | Risk-Off Drag |
Explore technical chart indicators on Investalks.in Technical Indicators Hub.
A. Central Pivot Range (CPR) for Tomorrow (Tuesday, September 8, 2026)
Calculations for Tuesday's session (September 8, 2026):
Derivatives Architecture & Option Chain Positioning
| Strike Price | Call Open Interest | Call Role | Put Open Interest | Put Role |
|---|---|---|---|---|
| 24,000 CE | 17.5M | Resistance Wall | — | — |
| 23,900 CE | 14.2M | Resistance Wall | — | — |
| 23,800 CE | 9.8M | Resistance Wall | 8.2M | Support Floor |
| 23,700 PE | — | — | 15.1M | Support Floor |
| 23,600 PE | — | — | 10.4M | Support Floor |
- Put-Call Ratio (PCR): Sits at 0.68 (Deep oversold territory, indicating high potential for a short-covering rally).
- 23,700 PE Support Wall: Holds 15.1 Million contracts, marking 23,700 as major support.
- 24,000 CE Call Wall: Holds 17.5 Million contracts, acting as overhead resistance.
- Max Pain Strike: Located at 23,80
Sectoral Heatmap & Market Breadth Breakdown
| Sector Index | Today's Change (%) | Technical Bias | Key Stocks |
|---|---|---|---|
| Nifty Pharma | +0.75% 🟢 | Outperforming Defensive | SUNPHARMA, CIPLA |
| Nifty Financial Services | -0.25% 🔴 | Relative Resilience | ICICIBANK, SBIN |
| Nifty Bank | -0.40% 🔴 | Consolidated | HDFCBANK, KOTAKBANK |
| Nifty Metal | -1.24% 🔴 | Commodity Drag | TATASTEEL, JSWSTEEL |
| Nifty Realty | -1.70% 🔴 | High Interest Sensitivity | DLF, GODREJPROP |
| Nifty IT | -2.28% 🔴 | Major Sector Drag | INFY, TCS, HCLTECH |
Definitive Support & Resistance Grid for Tuesday, September 8, 2026
| Level Classification | Exact Price Zone | Confluence Factors |
|---|---|---|
| Major Resistance 3 (R3) | 24,000 – 24,020 | 100-Day EMA + 24,000 CE Wall + Daily R2 |
| Intermediate Resistance 2 | 23,870 – 23,900 | 100-Day SMA + Daily R1 Pivot + 23,900 CE |
| Immediate Resistance 1 | 23,800 – 23,825 | Central Pivot (P) + Top Central CPR |
| Current Spot Price | 23,779.15 | Intraday Rebound Off 23,745.20 Low |
| Immediate Support 1 (S1) | 23,740 – 23,750 | Monday Intraday Low + Demand Base |
| Intermediate Support 2 (S2) | 23,700 – 23,710 | 23,700 PE Wall + Daily S1 Pivot |
| Major Structural Base (S3) | 23,620 – 23,630 | Daily S2 Pivot |
Probabilistic Scenarios for Tomorrow (Tuesday, September 8, 2026)
| Scenario | Probability | Market Condition / Trigger | Target / Expected Range |
|---|---|---|---|
| Scenario A | 50% | Oversold Short-Covering — Breaks & Holds > 23,825 | 23,870 → 23,980 |
| Scenario B | 35% | Support Consolidation — Holds 23,740–23,750 Base | Range: 23,740–23,825 |
| Scenario C | 15% | Bearish Breakdown — Sustained Close < 23,700 | 23,625 → 23,500 |
🟢 Scenario A: Oversold Short-Covering Relief Bounce (50% Probability)
- Pre-Conditions (September 8): Positive overnight Asian market cues and stabilization in US stock futures.
- Technical Trigger: Nifty opens above 23,800 and decisively crosses 23,825 (Central Pivot) on a 15-minute closing candle.
- Upside Targets:
- Primary Target: 23,870 – 23,900 (100-Day SMA & Daily R1)
- Secondary Target: 23,980 – 24,000 (100-Day EMA & 24,000 CE Wall)
- Technical Invalidation: A breakdown back below 23,740.
🟡 Scenario B: Support Consolidation & Range Trade (35% Probability)
- Pre-Conditions (September 8): Flat global market cues and muted morning opening.
- Technical Trigger: Nifty retests the 23,740 – 23,750 support zone in morning trade, forming a bullish rejection candle (hammer/doji).
- Upside Target: Rebound back toward 23,800 and 23,825.
- Technical Invalidation: Sustained 15-minute trading below 23,700.
🔴 Scenario C: Bearish Breakdown Below 23,700 (15% Probability)
- Pre-Conditions (September 8): Escalating geopolitical news, crude oil surging past $94.00/bbl, or aggressive Call writing.
- Technical Trigger: A sustained 15-minute closing breakdown below 23,700 (23,700 PE Wall & Daily S1).
- Downside Targets:
- Primary Target: 23,625 (Daily S2 Pivot)
- Secondary Target: 23,500 (Daily S3 Pivot)
- Technical Invalidation: A quick reclaim back above 23,780.
❓ Frequently Asked Questions (FAQs)
Nifty 50 fell 118.55 points (-0.50%) due to a sharp selloff in IT stocks (-2.28%), elevated crude oil prices (93.20/bbl), hawkish US Fed interest rate fears, and FII net cash outflows.
Technical analysis suggests a 50% probability of an oversold short-covering relief bounce toward 23,870–23,900, provided Nifty holds its 23,740–23,750 support zone and PCR (0.68) triggers short covering.
- Immediate Support: 23,740 – 23,750 (Monday Low)
- Major Support: 23,700 – 23,710 (15.1M Put OI Wall)
- Immediate Resistance: 23,800 – 23,825 (Central Pivot)
- Major Resistance: 23,870 – 23,900 (100-Day SMA & 14.2M Call OI Wall)
The Nifty IT index fell 2.28%, dragged down by Infosys (-3.76%) and TCS, following tech spending revisions in global markets.
The Nifty Pharma index outperformed, gaining +0.75%, led by buying interest in Sun Pharma and Cipla.
Brent crude prices trading above $91.80/bbl increase India's energy import bill, putting pressure on corporate margins in oil-sensitive sectors.
Implemented today under circular NSE/CMTR/74969, the 15-minute pre-open session is split into two phases: Phase 1 (09:00–09:05 AM for Market & Limit orders) and Phase 2 (09:05–09:10 AM for Limit orders ONLY).
A PCR of 0.68 indicates a deep oversold market condition, where put writing is light and short positions are stretched, often preceding a short-covering rally.
Bank Nifty closed at 56,980.40 (-0.40%). Key support sits at 56,750, with resistance at 57,250.
You can track real-time technical analysis, daily CPR levels, and stock market news on Investalks.in Market Wrap Hub.
Financial & Regulatory Disclaimer
InvesTalks provides stock market analysis, equity research, and financial content strictly for educational and informational purposes only. We are not a SEBI-registered investment advisor or portfolio manager. Market investments are subject to market risks. Always perform your own research or consult a certified SEBI-registered financial advisor before making buy/sell decisions.
Upcoming IPOs This Week (Sept 7–11): Analysis & Future Outlo...
NEXTApollo Hospitals (INE437A01024) Analysis: PAT (+38%), Target
Admin
Equity Research & Financial AnalysisCurated by the InvesTalks financial analysis team. Dedicated to providing disciplined stock market insights, technical chart evaluations, and long-term investor education.
 Market News & Outlook




Login to comment.