Analysts on Wall Street call it "the most widely used valuation metric in investing." Yet for millions of retail investors, it remains misunderstood — or worse, misused.
When Warren Buffett evaluates a stock, one of the very first numbers he checks is the Price-to-Earnings (P/E) ratio. Analysts on Wall Street call it "the most widely used valuation metric in investing." Yet for millions of retail investors, it remains misunderstood — or worse, misused.
In this guide, we break down exactly what the P/E ratio means, how to calculate it with real examples, what the current S&P 500 P/E ratio tells us about market valuation in 2026, and — most importantly — how you can put it to work in your own investment decisions. Whether you are a beginner or an experienced trader, this will be the only P/E guide you need.
What is the P/E Ratio?
The Price-to-Earnings ratio (also written as P/E or PE ratio) measures how much investors are willing to pay for each rupee (or dollar) of a company's earnings. It connects two fundamental pieces of information about a stock: its market price and its profitability.
In simple terms: if a stock trades at ₹1,000 and its earnings per share (EPS) is ₹50, investors are paying ₹20 for every ₹1 of earnings — a P/E of 20.
💡Quick Definition: The P/E ratio tells you the "price of earnings." A P/E of 25 means the market is paying ₹25 (or $25) for every ₹1 (or $1) of earnings the company generates.
Think of it like a real-estate rental yield — but in reverse. If a property earns ₹5 lakh/year and costs ₹1 crore, the "price-to-rent" ratio is 20. The lower that number, the better the deal for the buyer. The same logic applies to stocks, though with an important nuance: growth expectations matter enormously.
The P/E Ratio Formula
Price-to-Earnings Ratio Formula
Stock Price (Market Price Per Share)/Earnings Per Share (EPS) = P/E Ratio
Example:
🔢 Worked Example — Tech Company
Company: TechCorp Ltd.
Current Share Price: ₹2,400
Earnings Per Share (EPS, trailing 12 months): ₹80
P/E Ratio = ₹2,400 ÷ ₹80 = 30
Interpretation: Investors are paying ₹30 for every ₹1 of TechCorp's earnings. Whether that is expensive or cheap depends on the sector, growth trajectory, and market conditions.
How is EPS Calculated?
Earnings Per Share (EPS) is calculated by dividing the company's total net profit by the number of outstanding shares. For example, if a company earns ₹500 crore in net profit and has 10 crore shares outstanding, EPS = ₹50. This number feeds directly into the P/E formula and is reported quarterly in company earnings releases. You can track EPS data for NSE and BSE listed companies via portals like Screener.in or internationally via Yahoo Finance.
Trailing vs. Forward P/E Ratio
The P/E ratio comes in two important variants, and confusing them is one of the most common mistakes investors make:
📊 Trailing P/E (TTM)
Uses actual, reported earnings from the past 12 months
Based on real data — no guesswork
More reliable for mature, stable companies
Can look high if earnings temporarily dipped
Best for: Historical comparison, value analysis
🔭 Forward P/E
Uses analyst estimates of future earnings
More forward-looking and growth-sensitive
Subject to revision if forecasts miss the mark
Commonly used for growth stocks and IPOs
Best for: Growth investing, sector comparison
Pro Tip: Always check both trailing and forward P/E side by side. If the forward P/E is dramatically lower than the trailing P/E, the market is pricing in strong earnings growth ahead — which may or may not materialise.
Current Market P/E Data
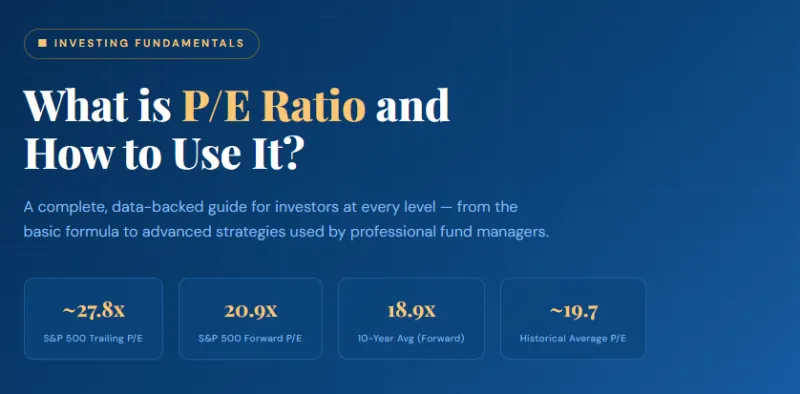
Understanding where the overall market's P/E stands is critical context for any individual stock analysis. Right now, the U.S. equity market is trading at a premium compared to long-run averages — here is the live picture:
~27.8xS&P 500 Trailing P/E (TTM)
20.9xS&P 500 Forward P/E
24.7x5-Year Avg Trailing P/E
23.2x10-Year Avg Trailing P/E
18.9x10-Year Avg Forward P/E
18.0%CY 2026 Projected EPS Growth
⚠️What This Means: The S&P 500's trailing P/E of ~27.8x is above both its 5-year average (24.7x) and its 10-year average (23.2x). The forward P/E of 20.9x is also above the 10-year forward average of 18.9x. This signals that while growth expectations are robust (analysts project 18% EPS growth for CY2026), the overall market is not cheap by historical standards.
"The P/E ratio is neither good nor bad in isolation — it only has meaning when compared to history, sector peers, and earnings growth expectations."
— Classic principle of equity valuation analysis
P/E Ratios Across Sectors
One of the biggest P/E mistakes is applying a universal "high" or "low" threshold across all industries. Different sectors naturally trade at vastly different P/E levels. Here is a reference guide for typical sector P/E ranges:
Sector
Typical P/E Range
Reason for Valuation
Status
Technology
25x – 50x+
High growth, scalable business models, large TAM
Premium
Consumer Discretionary
20x – 35x
Brand premiums, cyclical growth drivers
Moderate-High
Healthcare
18x – 30x
Pipeline value, pricing power, aging demographics
Moderate-High
Financials (Banks)
8x – 15x
Rate-sensitive earnings, regulatory capital constraints
Value Zone
Energy
8x – 16x
Commodity cycles, capital intensity
Value Zone
Utilities
12x – 20x
Regulated, stable income — valued like bonds
Bond Proxy
Real Estate (REITs)
20x – 40x (Price/FFO)
Asset value and dividend yield drive premiums
Asset-based
Consumer Staples
16x – 24x
Defensive quality, pricing power, steady demand
Defensive
Always benchmark a stock's P/E against its direct peers, not the entire market. A P/E of 35x sounds expensive in isolation, but for a SaaS company growing revenue at 40% annually, it may actually be below fair value. For deeper sector analysis, resources like NSE India and Yahoo Finance Sectors provide real-time sector P/E data.
How to Use the P/E Ratio in Your Analysis
Knowing the formula is step one. The real skill lies in interpreting and applying it correctly. Here is a proven, step-by-step framework:
1
Find the P/E Ratio. Look up the stock's current price and trailing/forward EPS on your brokerage platform, Screener.in (for Indian stocks), or Yahoo Finance. Both trailing and forward P/E should be noted.
2
Compare to the historical average of the same stock. Has the company typically traded at a P/E of 15x–20x over the past decade? If it is now at 40x, what has changed — growth acceleration, or irrational exuberance?
3
Benchmark against sector peers. Pull up 3–5 direct competitors and compare P/E ratios side by side. This reveals whether a company commands a premium or discount within its own peer group — and whether that premium is justified by superior growth or margins.
4
Use the PEG Ratio for context. The PEG Ratio (P/E divided by earnings growth rate) adjusts for growth. A P/E of 30 with 30% growth (PEG = 1.0) is often considered fairly valued. A P/E of 30 with just 5% growth (PEG = 6.0) is expensive. See our guide on the PEG Ratio explained.
5
Factor in the interest rate environment. High interest rates compress P/E ratios because bonds become more attractive. When the RBI or Fed raises rates, expect the market's aggregate P/E to contract. This is structural, not company-specific.
6
Look at earnings quality. Two companies with a P/E of 20x are not equally valued if one has genuine recurring earnings while the other's profits include one-time asset sales. Always check the income statement for non-recurring items. Our guide to reading an income statement covers this in detail.
✅The Golden Rule: No single metric should drive a buy or sell decision. The P/E ratio works best as part of a broader framework that includes revenue growth, return on equity (ROE), debt levels, and free cash flow. Learn more in our complete fundamental analysis checklist.
Limitations of the P/E Ratio
No metric is perfect — and the P/E ratio has well-documented blind spots that every investor must know:
Limitation
Why It Matters
What to Do Instead
Negative Earnings
P/E is meaningless if a company has no earnings (startups, turnarounds)
Use Price/Sales, EV/EBITDA, or Price/Book
Earnings Manipulation
Accounting adjustments can inflate EPS artificially
Cross-check with free cash flow (FCF) yield
One-Time Items
A large one-time gain/loss distorts the trailing P/E significantly
Use adjusted/normalised EPS figures
Ignores Debt
A highly levered company may look cheap on P/E but carry huge risk
Use EV/EBITDA, which includes net debt in the numerator
Cross-Country Comparisons
P/E norms differ by country (India's Nifty typically trades at higher P/E than UK FTSE)
Always compare within the same market/economy
Cyclical Industries
Mining, steel, and auto P/Es swing wildly with commodity cycles
Use through-the-cycle or normalised earnings
Alternatives: PEG, Shiller CAPE, EV/EBITDA
To overcome the P/E ratio's limitations, sophisticated investors use a toolkit of complementary metrics:
Shiller CAPE Ratio (Cyclically Adjusted P/E)
Created by Nobel laureate Robert Shiller, the CAPE ratio uses average inflation-adjusted earnings over 10 years — smoothing out business cycles. It is particularly useful for long-term market valuation. The CAPE is currently elevated for the U.S. market, suggesting potential long-run headwinds for equity returns.
PEG Ratio
PEG = P/E ÷ Earnings Growth Rate. A PEG below 1.0 is often considered undervalued, while a PEG above 2.0 suggests the stock may be expensive relative to its growth. Read our in-depth PEG ratio guide for examples.
EV/EBITDA
Enterprise Value to EBITDA is preferred by M&A professionals and private equity investors because it accounts for a company's debt load and is not affected by capital structure or tax rates. An EV/EBITDA below 10x is generally considered inexpensive. Learn more about EV/EBITDA analysis here.
Price-to-Book (P/B)
Particularly useful for banks, insurance companies, and capital-intensive businesses. When a company's P/B is below 1.0, the market is pricing its shares below the value of its assets — a potential deep-value signal. See our guide to Price-to-Book ratio investing.
Frequently Asked Questions
What is a good P/E ratio for a stock?
There is no universally "good" P/E ratio. A P/E of 10x may be excellent for a bank but worrying for a fast-growing tech company. Context is everything: compare the P/E to the company's historical range, its sector peers, and its expected earnings growth rate. Historically, the S&P 500 has averaged a P/E of around 15–20x, but individual stocks vary enormously.
What does a high P/E ratio mean?
A high P/E ratio means investors are paying a premium for earnings — usually because they expect strong future growth. However, it can also signal overvaluation if growth expectations are unrealistic. High P/E stocks carry more downside risk if earnings disappoint, since the market has already priced in an optimistic scenario.
What does a low P/E ratio mean?
A low P/E ratio may indicate an undervalued stock, a company in a mature low-growth industry, or a company facing genuine business challenges. Value investors actively seek low P/E stocks relative to peers — but it is critical to investigate why the P/E is low before buying. A "value trap" is a low P/E stock whose earnings are about to fall further.
What is the current P/E ratio of the Nifty 50?
The Nifty 50 P/E is published daily by the NSE on its official website. Historically, the Nifty 50 has traded at a P/E range of 16x–24x on a trailing basis, with readings above 24x often considered elevated for the Indian market. You can check the latest data at nseindia.com.
Can the P/E ratio be negative?
Yes — if a company reports a net loss (negative EPS), the P/E ratio becomes negative and is meaningless for valuation purposes. For loss-making companies (e.g., early-stage startups), analysts instead use Price/Sales, Price/Book, or EV/Revenue as valuation benchmarks.
How is the P/E ratio different from EPS?
EPS (Earnings Per Share) is a measure of profitability — it tells you how much profit the company earns for each share. The P/E ratio uses EPS as its input to express how much the market is paying for those earnings. EPS goes up when profits grow; the P/E goes up when investors are willing to pay more for each unit of earnings.
**Disclaimer: We are not SEBI registered. The content provided is for educational and informational purposes only and should not be considered investment advice. Stock market investments are subject to market risks. Please consult a SEBI-registered financial advisor before making investment decisions.**
InvesTalks is a powerful market learning and analysis platform built for traders, investors, and finance enthusiasts. Stay updated with real-time market insights, expert blogs, educational content, and smart investing strategies — all in one place.
ITS InvesTalks uses cookies to enhance your experience,
analyze traffic, and display relevant advertisements.
You can accept all cookies or manage your preferences.


Login to comment.