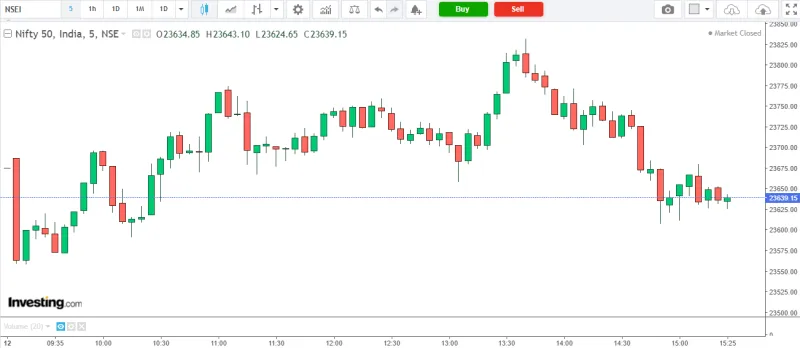
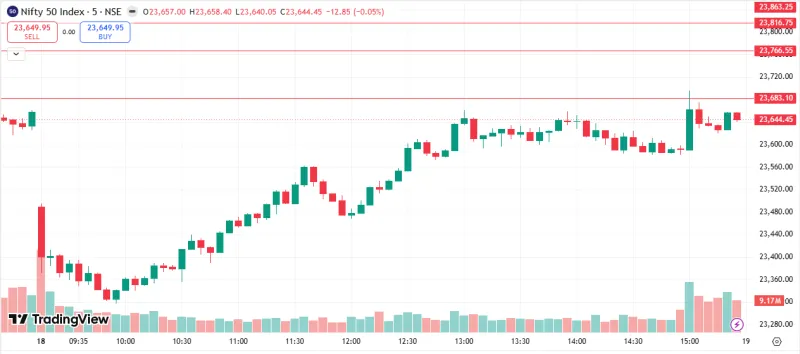
The Nifty 50 index is trading near 23,600 during early trade on 12 March 2026, showing mild bearish pressure after recent volatility. Technical indicators suggest neutral momentum with downside support near 23,500 and resistance around 24,000, indicating a possible sideways-to-bearish short-term trend if selling pressure continues.
Nifty 50 Market Sentiment Overview
The Indian equity market opened with a weak sentiment on 12 March 2026, with the Nifty 50 index trading around the 23,600 level during early trading hours. This decline reflects cautious investor sentiment after recent volatility and global market uncertainties.
The index has been facing selling pressure near the 24,000 level, which has become a key resistance zone in the short term. Market participants are closely watching technical indicators such as RSI, moving averages, and Bollinger Bands to determine whether the current weakness will lead to a deeper correction or a consolidation phase.
At present, the overall market tone can be described as neutral to slightly bearish, primarily because the index is trading below key short-term moving averages.
Today Market Data
Metric
Value
Index Value
~23,600
Previous Close
~23,865
Day High
~23,700 (approx intraday range)
Day Low
~23,550
RSI (14)
~48 (Neutral)
EMA20
~23,850 (approx)
EMA50
~24,050 (approx)
Bollinger Bands
Price near lower-middle band
Volume
Moderate intraday activity
Major Support
23,500 / 23,300
Major Resistance
23,900 / 24,200
Trend Bias
Short-term bearish to sideways
Today’s Nifty 50 Intraday Analysis
During the early session, Nifty opened weak and continued to trade in a narrow range between 23,550 and 23,700 levels.
Key observations from today’s price action
Lower highs formation
Selling pressure near resistance zones
Buyers defending the 23,500 support
These price movements suggest that traders are adopting a wait-and-watch approach, especially ahead of important macroeconomic cues and global market developments.
If the index breaks below 23,500, the next downside targets may appear near 23,300 and 23,000 levels.
However, a recovery above 23,900 could trigger short covering and push the index toward 24,200 resistance.
Comparison With Previous Trading Session
In the previous session, Nifty closed near 23,865, but the current trading session has opened with downward pressure.
Key differences vs previous day
Metric
Previous Session
Today
Trend
Sideways
Slightly bearish
Momentum
Neutral
Weak
RSI
~50
~48
Price vs EMA20
Slightly above
Below
This shift indicates that market momentum has weakened slightly, which explains the cautious behavior among traders.
Technical Indicator Analysis
RSI (Relative Strength Index)
The RSI currently sits around 48, which indicates a neutral momentum zone.
An RSI between 45 and 55 generally suggests consolidation rather than a strong trend.
Interpretation
RSI above 60 → bullish strength
RSI below 40 → bearish pressure
At the moment, Nifty is in a neutral momentum phase.
Moving Averages (EMA20 and EMA50)
Moving averages provide insight into short-term trend direction.
Current structure:
Price below EMA20
Price below EMA50
This indicates a short-term bearish bias in the market.
Trend Interpretation
If Nifty:
Breaks above EMA20 → bullish momentum may return
Breaks below 23,500 support → downside momentum may accelerate
Bollinger Bands Position
Bollinger Bands help identify volatility and potential reversals.
Current position:
Price near lower-middle band
Volatility slightly increasing
What this means
The index may either:
Bounce from lower band support
Continue drifting lower if selling pressure increases.
Major Support and Resistance Levels
Immediate Support
23,500 – Critical intraday support
23,300 – Strong swing support
23,000 – Psychological level
Immediate Resistance
23,900 – Short-term resistance
24,200 – Major resistance
24,500 – Breakout zone
These levels will likely determine the next major move in the index.
Momentum and Trend Analysis
From a broader perspective, Nifty is currently trading inside a consolidation range.
Traders are likely waiting for a clear breakout above 24,200 or breakdown below 23,300 before taking large directional positions.
Nifty 50 Prediction for Tomorrow
Bullish Scenario
If Nifty manages to:
Hold 23,500 support
Break 23,900 resistance
The index could rally toward:
24,200 – 24,350 levels
Short covering could accelerate this move.
Bearish Scenario
If selling pressure increases and Nifty breaks:
23,500 support
Possible targets:
23,300
23,000
This would signal short-term bearish continuation.
Sideways Scenario
Most likely scenario:
The market may consolidate between 23,500 and 23,900 until a fresh trigger appears.
Key Takeaways for Traders
Nifty trading near 23,600
RSI indicates neutral momentum
Index trading below key moving averages
Strong support at 23,500
Resistance at 23,900 – 24,200
Short-term outlook remains sideways to bearish unless resistance breaks.
**Disclaimer: We are not SEBI registered. The content provided is for educational and informational purposes only and should not be considered investment advice. Stock market investments are subject to market risks. Please consult a SEBI-registered financial advisor before making investment decisions.**
InvesTalks is a powerful market learning and analysis platform built for traders, investors, and finance enthusiasts. Stay updated with real-time market insights, expert blogs, educational content, and smart investing strategies — all in one place.
ITS InvesTalks uses cookies to enhance your experience,
analyze traffic, and display relevant advertisements.
You can accept all cookies or manage your preferences.


Login to comment.