
Index
- Introduction
- 2. Global Impacts & Macroeconomic Catalysts
- 3. Historical Movement Repetitions & Seasonality Insights
- 4. Technical Analysis & Key Nifty 50 Levels for Tomorrow
- 5. What Might Happen Tomorrow?
- 5. What Might Happen Tomorrow?
- 6. Key Takeaways for Market Observers
- Frequently Asked Questions (FAQs) - Nifty 50 Today & Tomorrow
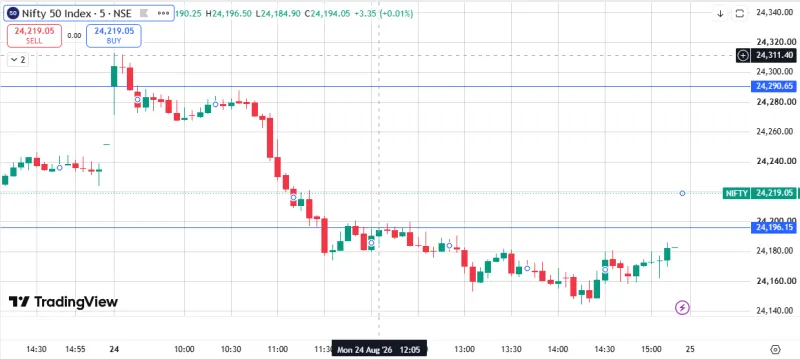
Nifty 50 Today 24 August 2026 & What Might Happen Tomorrow
 By Admin
|
Aug 24, 2026
|
1 min read
|
52
|
🤍
0
By Admin
|
Aug 24, 2026
|
1 min read
|
52
|
🤍
0
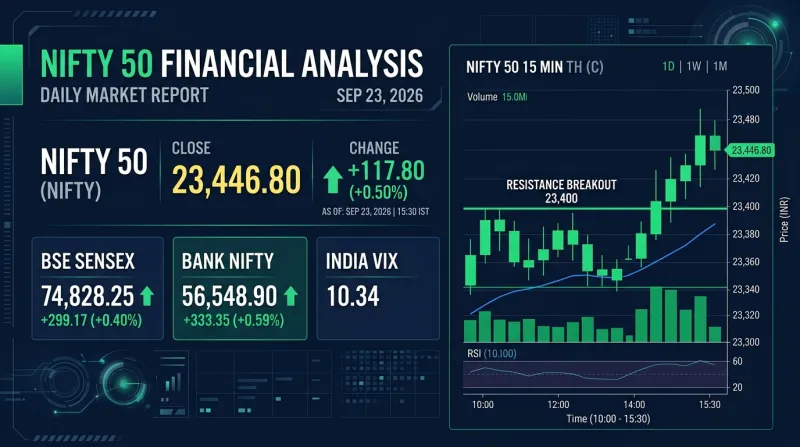
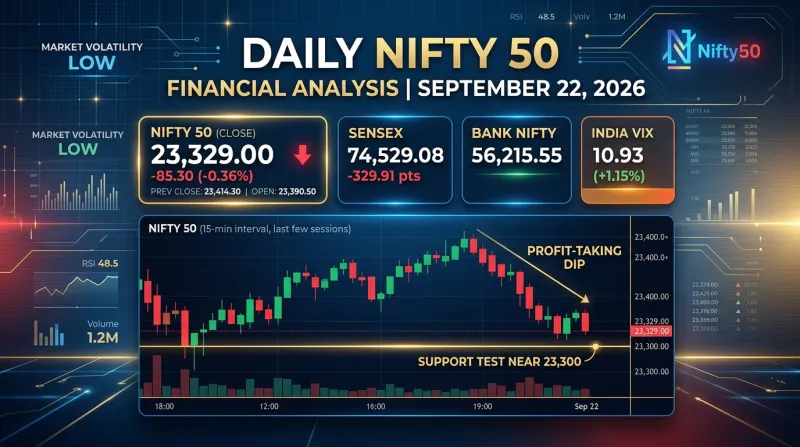
The Indian equity benchmark Nifty 50 today demonstrated classic range-bound behavior with a subtle bias toward consolidation, navigating a complex web of domestic resilience and global macroeconomic headwinds. As market participants parsed through global geopolitical developments, fluctuating crude oil prices, and shifting US Federal Reserve rate expectations, the index traded within a defined technical corridor.
For active traders and long-term market observers, understanding the price action of Nifty 50 today provides critical insights into market sentiment, institutional order flow, and structural support zones that could shape the movement in the next trading session.
Below is a detailed breakdown of today’s market performance, underlying historical patterns, global macro catalysts, and an expert technical outlook for tomorrow—without any buy or sell recommendations, adhering strictly to educational and analytical frameworks.
2. Global Impacts & Macroeconomic Catalysts
The Nifty 50 index does not trade in isolation; global cues play a decisive role in shaping morning gap-ups, gap-downs, and intraday trajectory.
| Global Catalyst | Key Components | Potential Impact on Nifty 50 |
|---|---|---|
| 🇺🇸 US Federal Reserve | Rate Expectations | Interest-rate outlook, FII flows and global liquidity |
| 🛢️ Crude Oil & DXY | Brent Crude + US Dollar Index | Inflation pressure, import costs and corporate margins |
| 🌍 Geopolitics & Supply Chains | Global conflicts, trade routes and supply disruptions | Risk sentiment, commodity prices and supply-chain stability |
1. US Federal Reserve & Interest Rate Outlook
Market participants are closely tracking commentary from the Federal Reserve regarding inflation trends and interest rate cuts. Any hawkish stance from the US Fed leads to capital outflows from Emerging Markets (EMs) like India back to US dollar-denominated assets. Conversely, rate cut expectations improve risk appetite globally.
2. Crude Oil Prices (Brent Crude) & Rupee Dynamics
India imports over 80% of its crude oil requirements. Recent fluctuations in Brent crude oil prices directly impact India’s import bill, corporate profit margins (especially for paints, tires, auto, and logistics), and domestic inflation. Moderate crude oil prices provide a macro tailwind for Nifty 50.
3. US Dollar Index (DXY) & US 10-Year Bond Yields
A rising US Dollar Index (DXY) puts depreciation pressure on the Indian Rupee (INR), causing foreign funds to recalibrate their emerging market portfolios. Stability in DXY and softening US 10-year Treasury yields serve as key prerequisites for a sustained breakout in Nifty 50.
4. GIFT Nifty & Global Futures Cues
Early morning setups for Nifty 50 tomorrow will heavily depend on overnight closes in US markets (S&P 500, Nasdaq 100) and early movement in GIFT Nifty trading at the GIFT City exchange in Gujarat.
3. Historical Movement Repetitions & Seasonality Insights
Technical analysis is founded on the premise that historical price behavior tends to repeat itself due to collective investor psychology.
1. The Consolidation Before Breakout Pattern
Historical charts of the Nifty 50 reveal that after significant trending moves, the index routinely undergoes 3 to 5 weeks of range-bound consolidation between major Fibonacci retracement levels.
- Historical Analog: Similar consolidation zones were witnessed prior to historic rallies in previous quarterly earnings seasons, where Nifty compressed within a 400-point band before breaking out in the direction of the dominant primary trend.
2. Seasonality Trends in Q3 / Pre-Festive Months
Historically, late August and early September seasonality data shows:
- Initial range-bound movement with heightened stock-specific action.
- Accumulation by long-term institutional buyers during minor dips toward the 50-day Exponential Moving Average (50-EMA).
- Pre-festive liquidity surges starting in mid-to-late September.
3. Mean Reversion to Moving Averages
Whenever the Nifty 50 stretches significantly away from its 20-day and 50-day EMAs, historical precedent dictates a mean reversion phase—either through time correction (sideways consolidation) or price correction (pullback). Current technical positioning reflects a healthy time-wise correction.
4. Technical Analysis & Key Nifty 50 Levels for Tomorrow
To analyze what might happen in Nifty 50 tomorrow, we look at key technical levels, oscillator setups, and derivative positioning.
Key Technical Levels Table
| Level Type | Nifty 50 Level | Technical Significance / Description |
|---|---|---|
| Major Resistance 2 | 24,600 | Critical supply zone & multi-week swing high |
| Immediate Resistance 1 | 24,400 – 24,450 | Upper band of current consolidation & Call OI concentration |
| Pivot Level | 24,300 | Intraday equilibrium zone & VWAP benchmark |
| Immediate Support 1 | 24,200 | Strong intraday demand zone & Put OI concentration |
| Major Support 2 | 24,000 | Key psychological benchmark & 50-day EMA alignment |
Technical Indicators Breakdown
| Indicator | Technical Status & Signal |
|---|---|
| Relative Strength Index (RSI 14) | 48–52 Range — Neutral / Equilibrium Zone |
| MACD (12, 26, 9) | Flat near signal line — Indicates Range-Bound Momentum |
| Moving Averages | Hovering near 20-EMA; above 50-EMA & 200-EMA |
| Option Chain PCR | ~0.92 — Slightly Cautious / Oversold Band |
Overall Technical Bias
| Factor | Reading |
|---|---|
| Momentum | 🟡 Neutral |
| Trend | 🟢 Mildly Positive above 50 & 200 EMA |
| MACD | 🟡 Range-Bound |
| PCR | 🟡 Slightly Cautious |
| Overall Bias | 🟡 Neutral to Mildly Bullish |
- RSI (14 Period): The daily Relative Strength Index is sitting around the 50 mark. An RSI between 45 and 55 reflects neutral momentum, confirming that the index is waiting for a directional trigger.
- Moving Average Alignment: Nifty 50 continues to trade comfortably above its long-term 200-day EMA, maintaining the broader structural bull trend. However, short-term moving averages (20-EMA) are flat, reflecting horizontal consolidation.
- Option Chain Analysis & Open Interest (OI):
- Call Open Interest (Resistance): Maximum Call OI build-up is concentrated at 24,400 and 24,500 strike prices, indicating that option writers expect overhead supply at these levels.
- Put Open Interest (Support): Maximum Put OI build-up is seen at 24,200 and 24,000 strikes, establishing a firm base of support.
- Put-Call Ratio (PCR): Hovering near 0.90 to 0.95, reflecting balanced positioning without extreme overbought or oversold conditions.
5. What Might Happen Tomorrow?
Based on technical patterns, option chain build-up, and global catalysts, here are the three plausible scenarios for Nifty 50 tomorrow:
| Scenario | Market Condition | Trigger Level | Target / Expected Move |
|---|---|---|---|
| 🟢 Scenario A — Bullish Breakout | Bullish continuation | Above 24,400 | Target 1: 24,480Target 2: 24,550–24,600 |
| 🔴 Scenario B — Bearish Breakdown | Bearish continuation | Below 24,200 | Target 1: 24,120Target 2: 24,000 |
| 🟡 Scenario C — Range-Bound Sideways | Consolidation | 24,200–24,400 | Support test at 24,200 → Rebound toward 24,350 |
5. What Might Happen Tomorrow?
| Scenario | Market Condition | Trigger Level | Target / Expected Move |
|---|---|---|---|
| 🟢 Scenario A — Bullish Breakout | Bullish continuation | Above 24,400 | Target 1: 24,480Target 2: 24,550–24,600 |
| 🔴 Scenario B — Bearish Breakdown | Bearish continuation | Below 24,200 | Target 1: 24,120Target 2: 24,000 |
| 🟡 Scenario C — Range-Bound Sideways | Consolidation | 24,200–24,400 | Support test at 24,200 → Rebound toward 24,350 |
Scenario A: Bullish Momentum (Sustained Move Above 24,400)
- Trigger: Strong positive cues from US markets, cooling crude oil prices, or lower US bond yields leading to a gap-up opening.
- Technical Path: If Nifty 50 opens above or breaks past 24,400 with strong volume and sustained price action above VWAP, short-covering among Call writers could propel the index toward 24,480 and eventually 24,550 – 24,600.
Scenario B: Bearish Breakdown (Pressure Below 24,200)
- Trigger: Negative global news flow, geopolitical escalation, or heavy foreign institutional selling.
- Technical Path: If the index slips and sustains below the vital 24,200 support level, unwinding of Put positions could trigger selling pressure toward 24,120, with the next major psychological safety cushion lying at 24,000.
Scenario C: Range-Bound Consolidation (Sideways Oscillations) - High Probability
- Trigger: Absence of fresh global triggers or flat morning opening in GIFT Nifty.
- Technical Path: The index continues to trade within the defined corridor of 24,200 to 24,400, offering premium decay opportunities for options strategies while stock-specific action dominates the tape.
6. Key Takeaways for Market Observers
- Watch the Boundaries: The 24,200 – 24,400 range remains the immediate decision zone for Nifty 50 tomorrow.
- Monitor Global Signals: Keep an eye on overnight US market closes, GIFT Nifty, US Dollar Index, and Brent crude oil.
- Respect Risk Management: Volatility can expand rapidly around key technical breakout or breakdown points; track position sizing and strict risk parameters.
Frequently Asked Questions (FAQs) - Nifty 50 Today & Tomorrow
Q1. What was the main trend of Nifty 50 today?
Ans: Nifty 50 today traded in a range-bound consolidation phase, forming a Doji/Spinning top pattern on the daily chart, reflecting indecision between buyers and sellers near key technical levels.
Q2. What are the key support levels for Nifty 50 tomorrow?
Ans: The immediate support for Nifty 50 tomorrow lies at 24,200. A breakdown below this level opens up room toward the major psychological and 50-EMA support zone at 24,000.
Q3. What are the key resistance levels for Nifty 50 tomorrow?
Ans: Immediate resistance is placed at 24,400 – 24,450 (Call OI concentration), followed by major overhead resistance at 24,600.
Q4. How do global factors affect Nifty 50 movement?
Ans: Factors such as US Federal Reserve interest rate expectations, US Dollar Index (DXY), 10-year bond yields, Brent crude oil prices, and GIFT Nifty futures significantly influence opening gaps and intraday liquidity flows in Nifty 50.
Financial & Regulatory Disclaimer
InvesTalks provides stock market analysis, equity research, and financial content strictly for educational and informational purposes only. We are not a SEBI-registered investment advisor or portfolio manager. Market investments are subject to market risks. Always perform your own research or consult a certified SEBI-registered financial advisor before making buy/sell decisions.
Hy-Tech Engineers IPO Review: Business, GMP & Final Verdict
NEXTHorizon Industrial Parks IPO Listing Price & Post-Listing Ou...
Admin
Equity Research & Financial AnalysisCurated by the InvesTalks financial analysis team. Dedicated to providing disciplined stock market insights, technical chart evaluations, and long-term investor education.
 Market News & Outlook
Login to comment.