
Index
- Introduction
- 1. Executive Market Summary: August 25, 2026 Scorecard
- 2. Macro Catalysts & Institutional Flow Dynamics
- 3. Multi-Timeframe Price Action Anatomy (Daily, 60-Min, 15-Min)
- 4. Indicator-by-Indicator Technical Deconstruction
- 5. Derivatives Architecture: Option Chain, PCR & Open Interest Distribution
- 6. Sectoral Heatmap & Market Breadth Breakdown
- 7. Definitive Support & Resistance Level Grid
- 8. Probabilistic Scenarios for Tomorrow's Session (August 26, 2026)
- 9. Risk Architecture & Volatility Sizing Principles
- 10. Frequently Asked Questions (FAQs)
Nifty 50 Reclaims 24,300: Technical Analysis & Tomorrow Outlook
 By Admin
|
Aug 25, 2026
|
1 min read
|
63
|
🤍
0
By Admin
|
Aug 25, 2026
|
1 min read
|
63
|
🤍
0
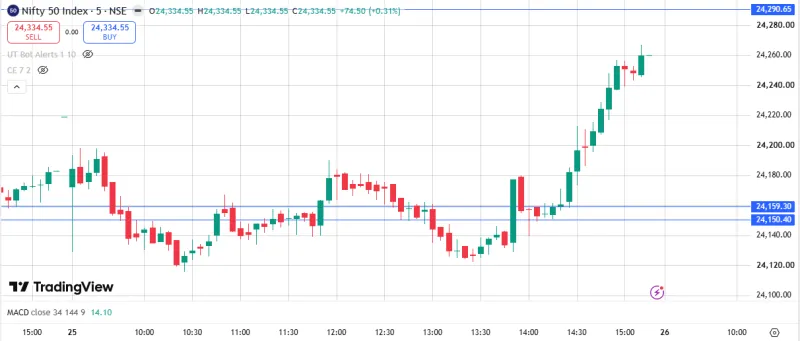
The Indian equity benchmark Nifty 50 staged an impressive late-afternoon V-shaped comeback on Tuesday, August 25, 2026, jumping 115.50 points (+0.48%) to close firmly above the key psychological barrier at 24,334.55.
After opening with a negative bias and slipping to an intraday low of 24,115.45 in early trade, strong institutional buying absorbed early short positions. The rally was bolstered by Foreign Institutional Investors (FIIs) turning net buyers (+₹1,181 Crore) alongside continued heavy support from Domestic Institutional Investors (+₹2,493 Crore).
Defensive sectors—led by Healthcare (+1.25%), Pharma (+0.98%), Consumer Durables (+0.95%), and PSU Banks (+0.88%)—propelled the index to reclaim its 20-day Simple Moving Average (SMA) midline and 50-day Exponential Moving Average (24,230).
This comprehensive research dossier provides an exhaustive multi-timeframe technical breakdown of the Nifty 50, evaluating Classical Price Action Geometry, Bollinger Bands (20, 2), Volume Spread Analysis (VSA), Relative Strength Index (RSI 14), Moving Average Ribbons (EMA 20/50/100/200), Central Pivot Range (CPR), and Derivatives Option Chain metrics to map out definitive structural support and resistance zones and probabilistic scenarios for tomorrow's session (Wednesday, August 26, 2026).
1. Executive Market Summary: August 25, 2026 Scorecard
The Nifty 50 opened Tuesday’s session at 24,210.30, drifted lower during morning trade to hit an intraday low of 24,115.45, and initiated an aggressive afternoon impulse leg that surged over 236 points from the lows to touch an intraday high of 24,352.10, settling at 24,334.55.
Market Index Snapshot — August 25, 2026
| Index / Metric | August 25, 2026 Value | Previous Close | Net Change | Direction |
|---|---|---|---|---|
| Nifty 50 (NSE Spot) | 24,334.55 | 24,219.05 | +115.50 (+0.48%) | 🟢 |
| BSE Sensex | 77,656.09 | 77,369.11 | +286.98 (+0.37%) | 🟢 |
| Nifty Bank | 57,514.20 | 57,525.95 | -11.75 (-0.02%) | 🔴 |
| Nifty Midcap 100 | 58,420.15 | 58,105.80 | +314.35 (+0.54%) | 🟢 |
| Nifty Smallcap 100 | 18,465.30 | 18,483.80 | -18.50 (-0.10%) | 🔴 |
| India VIX | 11.45 | 11.82 | -0.37 (-3.13%) | 📉 |
| NSE Market Breadth | Advances: 1,672 | Declines: 1,843 | Ratio: 0.91 (Abs) | 🟡 |
Quick Market Reading
| Factor | Reading |
|---|---|
| Nifty 50 | 🟢 Positive (+0.48%) |
| Sensex | 🟢 Positive (+0.37%) |
| Nifty Bank | 🔴 Marginally Negative |
| Midcap 100 | 🟢 Outperforming (+0.54%) |
| Smallcap 100 | 🔴 Marginally Negative |
| India VIX | 📉 Falling — Lower Volatility |
| Market Breadth | 🟡 Slightly Negative / Absolute |
| Overall Market Tone | 🟢 Index-positive, but breadth remains mixed |
The intraday range expanded to 236.65 points, confirming an injection of fresh institutional momentum.
2. Macro Catalysts & Institutional Flow Dynamics
INSTITUTIONAL LIQUIDITY INJECTION
[ FII Cash Flow: +₹1,181 Cr ] ───┐
├───► [ Total Institutional Buy: +₹3,674 Cr ] ───► [ V-Shaped Reversal ]
[ DII Cash Flow: +₹2,493 Cr ] ───┘
A. The Institutional Pivot: FIIs Turn Net Buyers
For the first time in recent sessions, Foreign Institutional Investors (FIIs) recorded net buying of +₹1,181 Crore in cash equities. Coupled with Domestic Institutional Investor (DII) net buying of +₹2,493 Crore, the combined daily net influx reached +₹3,674 Crore, creating an overwhelming buy-side imbalance.
B. Geopolitical De-escalation & Commodity Relief
Sovereign bond yields stabilized, and Brent crude oil moderated back toward $89.50/barrel after international sanctions came in line with market expectations, easing fears of immediate energy inflation.
3. Multi-Timeframe Price Action Anatomy (Daily, 60-Min, 15-Min)
DAILY TIMEFRAME: BULLISH ENGULFING REVERSAL ABOVE 50 EMA & 20 SMA
24,850 ─ (Previous Swing Peak)
24,450 ─ (Immediate Resistance / 20 EMA)
24,334 = [ TODAY'S CLOSE: 24,334.55 ] (Reclaimed 24,300)
24,230 ── 50-Day EMA Floor Reclaimed
23,998 ── 100-Day EMA Bedrock
A. Daily Timeframe: Bullish Engulfing Reversal
- Candlestick Pattern: Tuesday’s daily candle printed a strong Bullish Engulfing / Piercing Reversal Bar, completely engulfing the price bodies of the prior two sessions.
- Reclaiming the 50 EMA & 20 SMA Midline: The daily close at 24,334.55 brought the index back above its 50-day EMA (24,230) and the 20-day SMA midline (24,320).
B. 60-Minute (Hourly) Timeframe: Liquidity Sweep & Value Area Re-entry
- Liquidity Sweep at 24,115: The morning dip to 24,115.45 swept stop losses below Friday's low (24,206), trapped aggressive bears, and triggered a sharp V-shaped short squeeze.
- Hourly Bullish Structure: Higher high and higher low sequences were re-established on the 1-hour timeframe, with immediate demand base shifting up to 24,240–24,270.
C. 15-Minute Intraday Microstructure
- 09:15 – 11:30: Gradual sell-off to intraday low of 24,115.45 on low volume.
- 11:30 – 14:00: Rebound back above VWAP (24,210) driven by healthcare and PSU banking accumulation.
- 14:00 – 15:30: Aggressive short-covering surge pushing price through 24,300 to close near the high of the day at 24,334.55.
4. Indicator-by-Indicator Technical Deconstruction
| Technical Indicator | Current Value / Setting | Historical Regime | Technical Signal |
|---|---|---|---|
| Bollinger Bands (20, 2) | Upper: 24,720Middle: 24,320Lower: 23,920 | — | — |
| BB Bandwidth (BBW) | 3.28% | Moderate Expansion | 🟢 Bullish Rebound |
| %B Indicator | 0.518 | Above Midline (>0.50) | 🟢 Bullish Control |
| RSI (14-Period, Daily) | 53.20 | Re-entered Bull Zone | 🟢 Bullish Momentum |
| RSI (14-Period, 60-Min) | 58.40 | Positive Momentum | 🟢 Strong Upside Bias |
| 20-Day EMA | 24,380.00 | Price < 20 EMA (Testing) | 🟡 Overhead Target |
| 50-Day EMA | 24,230.00 | Price > 50 EMA | 🟢 Reclaimed Floor |
| 100-Day EMA | 23,998.00 | Price > 100 EMA | 🟢 Structural Bedrock |
| 200-Day EMA | 23,365.00 | Price > 200 EMA | 🟢 Macro Bull Floor |
| MACD (12, 26, 9) | Line: -42.10Signal: -50.30Histogram: +8.20 | — | 🟢 Bullish Crossover |
| Daily CPR (Wednesday) | TC: 24,301P: 24,268BC: 24,235 | Moderately Wide | 🟡 Moderate Range |
| India VIX | 11.45 | Low Volatility Tier | 🟢 Risk-On Shift |
A. Bollinger Bands (20, 2) & Midline Reclaim Analysis
- The %B Metric (0.518): %B rose to 0.518, confirming that price has moved above the 20-day SMA midline into the upper half of the statistical volatility channel.
- Lower Band Rejection Confirmation: The rejection from the Lower Band (24,025) and subsequent close above the 20 SMA confirms a classic Bollinger Band mean-reversion cycle.
B. Volume Spread Analysis (VSA) & Volume Profile Metrics
- Point of Control (POC): Moved up to 24,340, aligning right at today's close.
- Volume Spread Behavior: Volume expanded by 22% over yesterday's volume, confirming "Demand Absorption & Effort versus Result"—heavy buying effort resulted in a 236-point upside swing from intraday lows.
C. Relative Strength Index (RSI 14) Momentum Shift
- Daily RSI (53.20): Daily RSI crossed above the 50 equilibrium mark, confirming that bullish momentum has regained control.
- 60-Minute RSI (58.40): Moving toward 60, indicating positive momentum flow across hourly charts.
D. Exponential Moving Average (EMA) Ribbon Alignment
- 50 EMA Reclaimed: Spot (24,334) is trading back above the 50-day EMA (24,230).
- Testing 20 EMA: The 20-day EMA sits at 24,380. A daily close above 24,380 opens a clear path toward 24,480–24,500.
E. MACD (12, 26, 9) Bullish Crossover Confirmation
- MACD Line: Crossed above the Signal Line (Line: -42.10 vs Signal: -50.30).
- Histogram: Turned positive to +8.20, confirming a fresh bullish momentum cycle on the daily timeframe.
F. Central Pivot Range (CPR) & Daily Pivots
Calculations for Wednesday's session (August 26, 2026):
Pivot (P)=High+Low+Close3=24,352.10+24,115.45+24,334.553≈24,267.37Pivot (P)=3High+Low+Close=324,352.10+24,115.45+24,334.55≈24,267.37
Bottom Central (BC)=High+Low2=24,352.10+24,115.452≈24,233.78Bottom Central (BC)=2High+Low=224,352.10+24,115.45≈24,233.78
Top Central (TC)=(Pivot−BC)+Pivot≈24,300.96Top Central (TC)=(Pivot−BC)+Pivot≈24,300.96
| Pivot Level | Price (Points) | Technical Significance |
|---|---|---|
| 🔴 Resistance 3 (R3) | 24,588.60 | Extreme Bullish Target Zone |
| 🔴 Resistance 2 (R2) | 24,452.00 | Major Supply Zone & VAH |
| 🟠 Resistance 1 (R1) | 24,393.30 | 20-Day EMA & Immediate Resistance |
| ⚪ Central Pivot (P) | 24,267.37 | Session Equilibrium / Support Base |
| 🟢 Support 1 (S1) | 24,156.65 | Intraday Support Buffer |
| 🟢 Support 2 (S2) | 24,030.70 | 50-Day EMA / Lower Bollinger Cushion |
| 🔵 Support 3 (S3) | 23,920.00 | 100-Day EMA Major Structural Base |
5. Derivatives Architecture: Option Chain, PCR & Open Interest Distribution
A. Put-Call Ratio (PCR) Expansion to 1.14
- Current Total PCR (OI): 1.14 (Up from 0.68 earlier this week!).
- Interpretation: The rise to 1.14 reflects heavy put writing support at 24,300 PE and 24,200 PE, signaling that option writers expect lower levels to be defended.
B. Strike-Wise Open Interest Shifts
- Call Unwinding at 24,300 CE: Call writers aggressively unwound short positions at 24,300 CE as the index rallied afternoon.
- Put Building at 24,300 PE & 24,200 PE: Heavy put open interest addition of 14.8M contracts at 24,300 PE establishes 24,300 as the immediate floor.
- Max Pain Strike: Shifted upward to 24,350.
6. Sectoral Heatmap & Market Breadth Breakdown
| Sector Index | Today's Change (%) | Technical Bias | Key Leaders |
|---|---|---|---|
| Nifty Healthcare | +1.25% 🟢 | Outperforming Rally | MAXHEALTH, APOLLOHOSP |
| Nifty Pharma | +0.98% 🟢 | Strong Momentum | SUNPHARMA, LUPIN |
| Nifty Consumer Durables | +0.95% 🟢 | Demand Rebound | TITAN, DIXON |
| Nifty PSU Bank | +0.88% 🟢 | Value Buying | SBIN, BANKBARODA |
| Nifty IT | +0.45% 🟢 | Recovery Phase | INFY, HCLTECH |
| Nifty Auto | +0.32% 🟢 | Mild Recovery | M&M, TATAMOTORS |
| Nifty Private Bank | -0.15% 🔴 | Consolidation Drag | HDFCBANK, ICICIBANK |
| Nifty Metal | -0.42% 🔴 | Mild Profit Booking | TATASTEEL, JSWSTEEL |
7. Definitive Support & Resistance Level Grid
| Level Classification | Exact Price Zone | Confluence Factors |
|---|---|---|
| 🔴 Major Resistance 3 (R3) | 24,480 – 24,500 | 24,500 Call Wall + VAH + Daily R2 |
| 🟠 Intermediate Resistance 2 (R2) | 24,380 – 24,400 | 20-Day EMA + Pivot R1 + 24,400 CE Wall |
| 🟡 Immediate Resistance 1 (R1) | 24,350 – 24,360 | Today's High + Max Pain Strike |
| ⚪ CURRENT SPOT PRICE | 24,334.55 | Above 50-Day EMA & 20-Day SMA Midline |
| 🟢 Immediate Support 1 (S1) | 24,280 – 24,300 | 24,300 PE Wall + Daily CPR TC + Point of Control |
| 🟢 Intermediate Support 2 (S2) | 24,220 – 24,240 | 50-Day EMA + 24,200 PE Wall + CPR BC |
| 🔵 Major Structural Base (S3) | 24,115 – 24,140 | Today's Intraday Low + 100-Day EMA Buffer |
8. Probabilistic Scenarios for Tomorrow's Session (August 26, 2026)
Probabilistic Scenario Decision Tree — August 25, 2026
| Scenario | Probability | Market Condition | Trigger / Confirmation | Target / Expected Move |
|---|---|---|---|---|
| 🟢 Scenario A — Bullish Momentum Continuation | 55% | Bullish continuation | Breaks and holds above 24,380 | 24,450 → 24,500 |
| 🟡 Scenario B — Consolidation Pullback | 30% | Controlled pullback | Retests 24,260–24,280 zone | Rebound toward 24,350 |
| 🔴 Scenario C — Bearish Breakdown | 15% | Bearish reversal | Breaks below 24,220 | 24,140 → 24,080 |
Decision Levels
| Price Level | Role |
|---|---|
| 24,500 | 🔴 Major upside resistance / target |
| 24,450 | 🟢 Bullish continuation target |
| 24,380 | 🟢 Primary bullish trigger |
| 24,350 | 🟡 Rebound target |
| 24,260–24,280 | 🟡 Pullback / retest zone |
| 24,220 | 🔴 Bearish breakdown trigger |
| 24,140 → 24,080 | 🔴 Downside targets |
Market Open: 09:15 AM
Highest-probability scenario: 🟢 Scenario A — 55% Bullish Momentum Continuation
🟢 Scenario A: Bullish Momentum Continuation (55% Probability)
- Pre-Conditions: Stable global markets, FII net buying continuation, and GIFT Nifty indicating a positive open above 24,350.
- Technical Trigger: Nifty breaks and holds above 24,380 (20-Day EMA) on a 15-minute closing basis during early trade.
- Structural Targets:
- Primary Objective: 24,450 (Daily R2 Pivot)
- Secondary Extension: 24,480 – 24,500 (Major 24,500 Call OI Wall & VAH)
- Technical Invalidation: A drop back below 24,280.
🟡 Scenario B: Shallow Consolidation Pullback & Re-Accumulation (30% Probability)
- Pre-Conditions: Flat global cues and minor profit booking after Tuesday's rally.
- Technical Trigger: Nifty experiences a morning pullback toward the 24,260–24,280 CPR support zone and forms a bullish rejection candle (hammer/engulfing).
- Structural Targets: Rebound back toward 24,350 and 24,400.
- Technical Invalidation: Sustained trading below 24,220.
🔴 Scenario C: Bearish Failure Breakdown (15% Probability)
- Pre-Conditions: Sudden negative global catalyst or sharp reversal in crude oil prices.
- Technical Trigger: A sustained breakdown below 24,220 (50-Day EMA) on a 15-minute closing basis.
- Structural Targets: 24,140 and 24,080.
9. Risk Architecture & Volatility Sizing Principles
- 50 EMA Dynamic Floor: The 50-day EMA (24,230) serves as the dynamic line in the sand. As long as price holds above 24,230, buy-on-dips market structure remains active.
- India VIX Sizing: With India VIX cooling to 11.45, market volatility remains low, favoring trend-following setups over extreme counter-trend scalping.
10. Frequently Asked Questions (FAQs)
1. Why did the Nifty 50 rally sharply today?
The rally was driven by strong institutional buying (+₹3,674 Cr total cash injection, with FIIs turning net buyers +₹1,181 Cr), de-escalation of crude oil fears, and strong buying in Healthcare, Pharma, and PSU Banks.
2. Has the short-term trend turned bullish for Nifty?
Yes, the daily candle printed a Bullish Engulfing pattern, reclaiming the 50-day EMA (24,230) and 20-day SMA midline (24,320), while RSI crossed above 50 and MACD gave a bullish crossover.
3. What are the key support and resistance levels for tomorrow?
- Immediate Support: 24,280 – 24,300
- Major Support: 24,220 – 24,240
- Immediate Resistance: 24,350 – 24,380
- Major Resistance: 24,450 – 24,500
Financial & Regulatory Disclaimer
InvesTalks provides stock market analysis, equity research, and financial content strictly for educational and informational purposes only. We are not a SEBI-registered investment advisor or portfolio manager. Market investments are subject to market risks. Always perform your own research or consult a certified SEBI-registered financial advisor before making buy/sell decisions.
Horizon Industrial Parks IPO Listing Price & Post-Listing Ou...
NEXTNifty 50 Erases Early Gains on Monthly Expiry Volatility
Admin
Equity Research & Financial AnalysisCurated by the InvesTalks financial analysis team. Dedicated to providing disciplined stock market insights, technical chart evaluations, and long-term investor education.
 Market News & Outlook
Login to comment.