
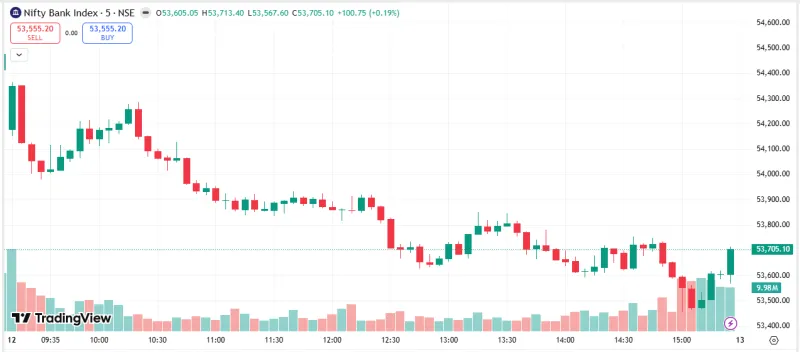
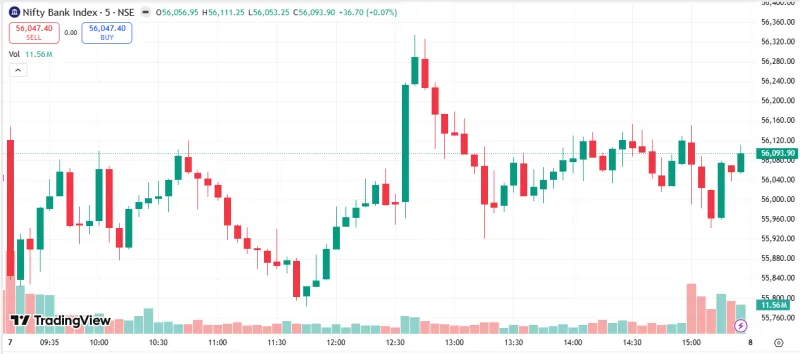
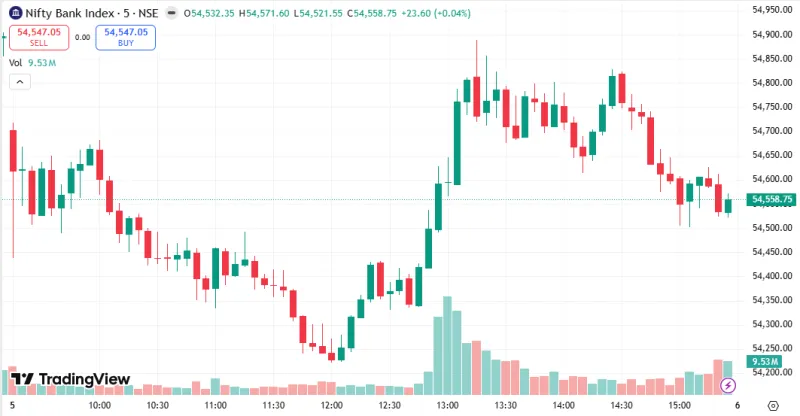
Complete technical analysis of NIFTY BANK including RSI EMA Bollinger Bands support resistance and prediction.
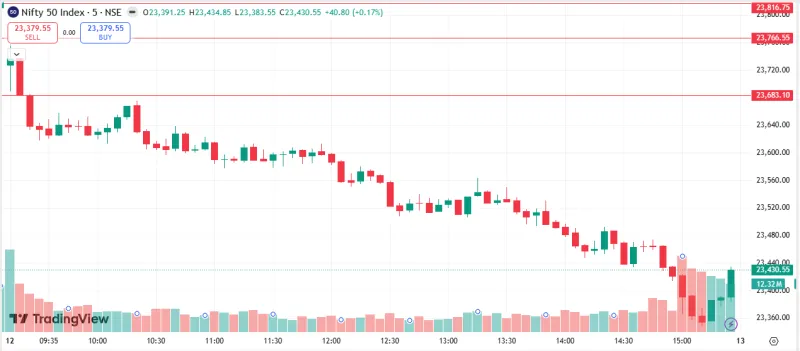
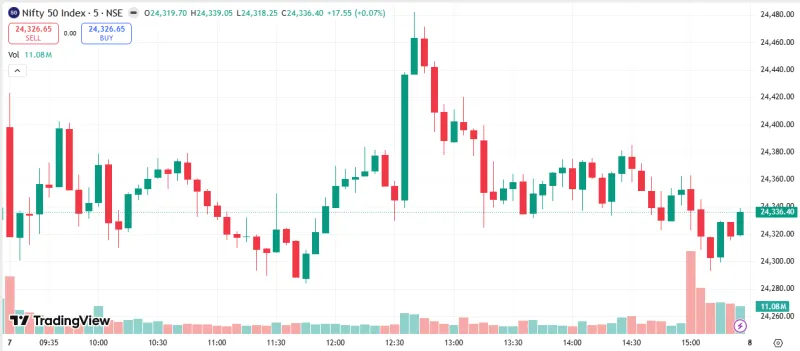
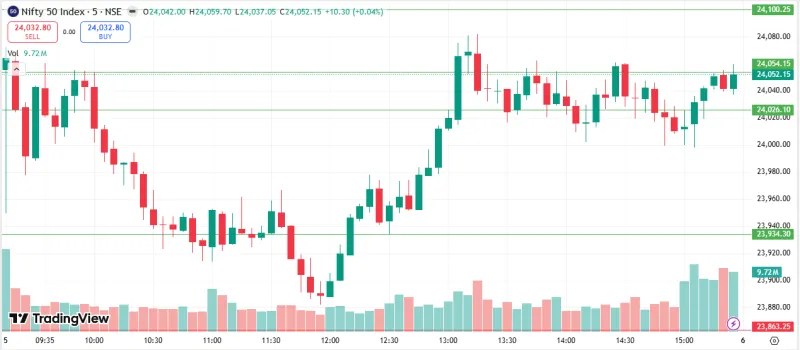
Complete technical analysis of NIFTY 50 including RSI EMA Bollinger Bands support resistance and prediction.
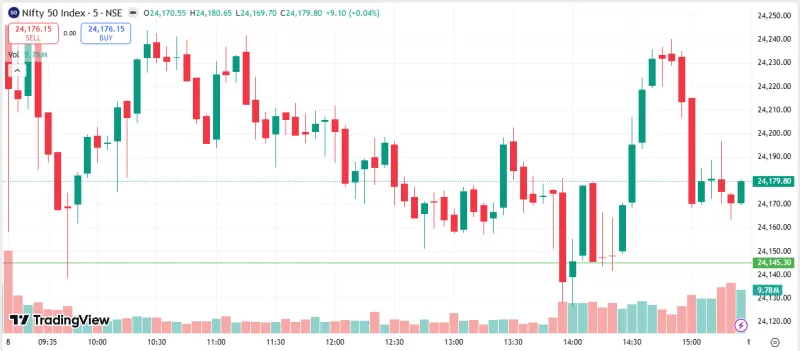
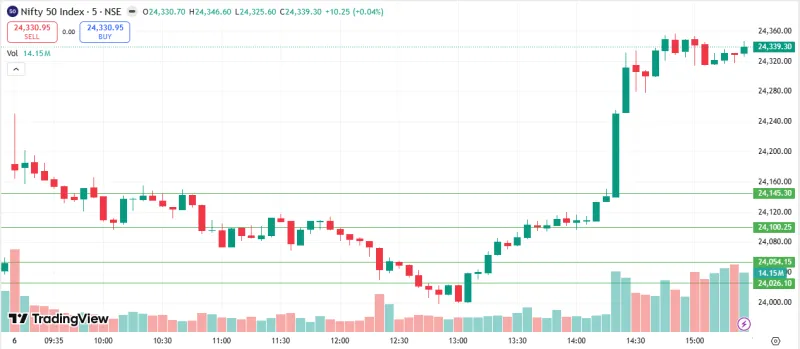
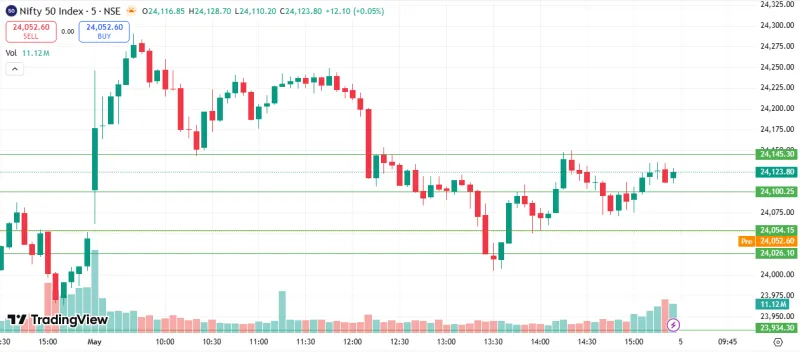
Complete technical analysis of NIFTY 50 including RSI EMA Bollinger Bands support resistance and prediction.
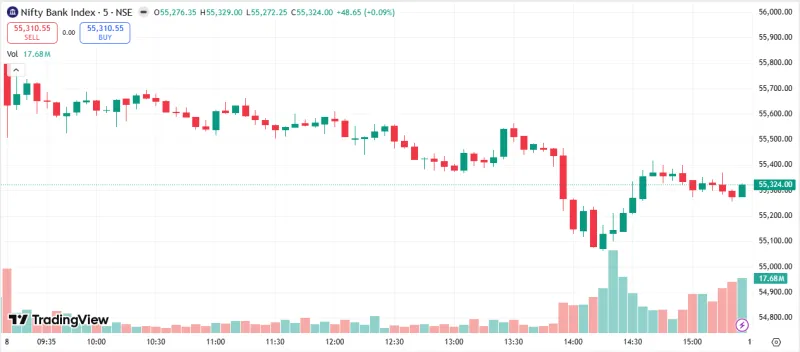
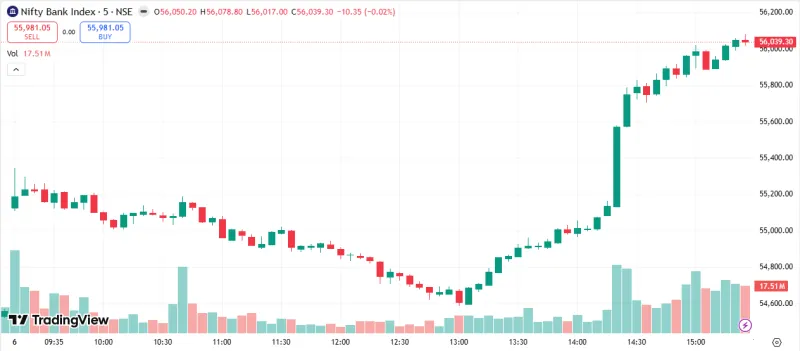
Complete technical analysis of NIFTY BANK including RSI EMA Bollinger Bands support resistance and prediction.
Complete technical analysis of NIFTY 50 including RSI EMA Bollinger Bands support resistance and prediction.
Complete technical analysis of NIFTY BANK including RSI EMA Bollinger Bands support resistance and prediction.
Complete technical analysis of NIFTY 50 including RSI EMA Bollinger Bands support resistance and prediction.
Complete technical analysis of NIFTY BANK including RSI EMA Bollinger Bands support resistance and prediction.
Complete technical analysis of NIFTY 50 including RSI EMA Bollinger Bands support resistance and prediction.
Complete technical analysis of NIFTY BANK including RSI EMA Bollinger Bands support resistance and prediction.
Complete technical analysis of NIFTY 50 including RSI EMA Bollinger Bands support resistance and prediction.
Complete technical analysis of NIFTY BANK including RSI EMA Bollinger Bands support resistance and prediction.
InvesTalks is a powerful market learning and analysis platform built for traders, investors, and finance enthusiasts. Stay updated with real-time market insights, expert blogs, educational content, and smart investing strategies — all in one place.